Select the method or formula of your choice.
In This Topic
Calculating power for test mean – reference mean (Difference)
Power
Let tα,v be the upper α (one-sided) critical value for a t-distribution with v degrees of freedom. The power for the two-sided alternative hypothesis of Lower limit < test mean - reference mean < upper limit is given by:

For the alternative hypothesis of Test mean > reference mean or Test mean - reference mean > lower limit, the power is given by:

For the alternative hypothesis of Test mean < reference mean or Test mean - reference mean < upper limit, the power is given by:

where CDF(x; v, λ) is the cumulative distribution function, evaluated at x, for a noncentral t-distribution with noncentrality parameter, λ, and v degrees of freedom.
Degrees of freedom
The degrees of freedom, v, is given by:

For power calculations, n is assumed to be the same for both sequences.
Noncentrality parameters
The noncentrality parameter that corresponds to the lower equivalence limit is denoted as λ1, and is given by:

where σ is the within-subject standard deviation.
For the alternative hypothesis of Test mean > reference mean, δ1 = 0.
The noncentrality parameter that corresponds to the upper equivalence limit is denoted as λ2, and is given by the following formula:

where δ2is the upper equivalence limit.
For the alternative hypothesis of Test mean < reference mean, δ2 = 0.
Notation
| Term | Description |
|---|---|
| α | significance level for the test |
| D | mean of the test population minus the mean of the reference population |
| δ1 | lower equivalence limit |
| δ2 | upper equivalence limit |
| n | number of participants in each sequence. (For power calculations, n is assumed to be the same for both sequences.) |
Calculating power for test mean / reference mean (Ratio, by log transformation)
This topic describes how power is calculated when you select Test mean / reference mean (Ratio, by log transformation) in Hypothesis about.
Power
Let tα,v be the upper α (one-sided) critical value for a t-distribution with v degrees of freedom. The power for the two-sided alternative hypothesis of Lower limit < test mean / reference mean < upper limit is given by:

For the alternative hypothesis of Test mean / reference mean > lower limit, the power is given by:

For the alternative hypothesis of Test mean / reference mean < upper limit, the power is given by:

where CDF(x; v , λ) is the cumulative distribution function, evaluated at x, for a noncentral t-distribution with noncentrality parameter, λ, and v degrees of freedom.
Degrees of freedom
The degrees of freedom, v, is given by:

For power calculations, n is assumed to be the same for both sequences.
Noncentrality parameters
The noncentrality parameter that corresponds to the lower equivalence limit is denoted as λ1, and is given by:
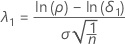
where σ is the within-subject standard deviation as described below.
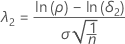
The noncentrality parameter that corresponds to the upper equivalence limit is denoted as λ2, and is given by::
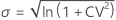
Sigma
The standard deviation, σ, is calculated using the within-subject coefficient of variation (CV) as follows:
Notation
| Term | Description |
|---|---|
| α | significance level for the test |
| ρ | ratio of the test population mean to the reference population mean |
| δ1 | lower equivalence limit |
| δ2 | upper equivalence limit |
| n | number of participants in each sequence. (For power calculations, n is assumed to be the same for both sequences.) |