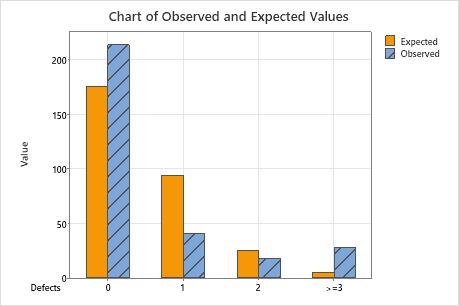
- Bar chart of the observed and the expected values
-
This bar chart shows, for each category, whether the number of observed values differs from the number of expected values.
- Bar chart of each category’s contribution to the chi-square value
- This bar chart plots each category's contribution to the chi-square value to determine which category's contribution is the highest. If you deselect Display bars from the largest to the smallest, the order of the categories is the order that the categories appear in your worksheet. If you set the value order for the column of data or the column of category labels, Minitab uses the order that you set. For more information on setting the value order, go to Change the display order of text values in Minitab output.
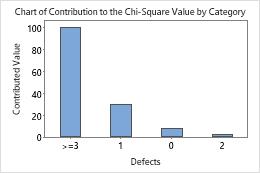
Largest to smallest
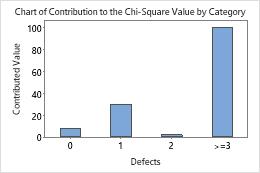
Category order