Uses of the smallest extreme value distribution to model reliability data
The smallest extreme value distribution is a limiting distribution for the minimum of a very large collection of random observations from the same arbitrary distribution. This distribution is a useful model in situations where many identical and independent processes can lead to failure and the first one to fail determines the failure time. This is sometimes referred to as the worst or the weakest link.
- Which material can withstand the largest load?
- How many items are expected to break during the warranty period?
- What is the minimum force needed to break a pouch when multiple strength tests are conducted on different sections of each part?
- Which cable holds a load of 1,000 pounds better?
The smallest extreme value distribution is frequently appropriate for product failures related to load and strength. The extreme value distribution is used to model minimum values. When using this distribution, you are usually not concerned with the distribution of variables that describe most of the population but only with the extreme values that can lead to failure. In other words, you are investigating imperfections in certain materials that can cause nonuniform stress under a load. The strength of the material is thus related to the effect of the imperfection causing the largest reduction in strength (the weakest link).
The relationship between the smallest extreme value distribution and the Weibull distribution is similar to that between the normal and lognormal distributions. Specifically, the log base e of a variable following a Weibull distribution has a smallest extreme value distribution.
Despite this equivalence, the distributions are not strictly interchangeable in their applications. The National Institute of Standards and Technology (NIST) recommends trying the smallest extreme value distribution in "any modeling application for which the variable of interest is the minimum of many random factors, all of which can take positive or negative values."
One common application is dielectric breakdown in capacitors, where many flaws compete to be the eventual site of failure. A different example is semiconductor wire bonds, which usually do not fracture or overheat under normal operating conditions, unless they are subject to extreme electrical load or extremely low bond strength. Similarly, coolant tubes have a minimum thickness to provide adequate heat transfer to coolant liquid. But a failure occurs if the hot combustion gases burn "pinholes" through any point on the tubes.
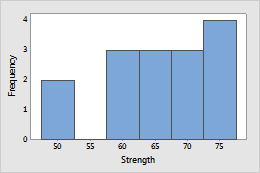
Example 1: Wire strength
Wire samples of equal length are tested for breaking strength. The results are modeled using the smallest extreme value distribution.
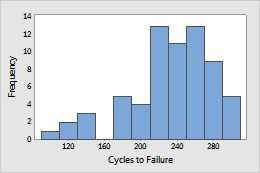
Example 2: Cycles until failure
Engineers subject an alloy specimen to a total of 300,000 cycles and measure the number of cycles until failure.
Probability density function and hazard function for the extreme value distribution
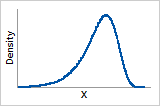
Probability density function
For the extreme value distribution, the probability density function is usually skewed to the left.
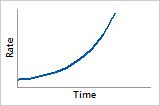
Hazard function
The hazard function of the smallest extreme value distribution shows a risk of failure that is exponentially increasing.