Pp
Pp is calculated using the parameter values that you specify or is estimated using maximum likelihood method for a distribution used in the analysis. Minitab calculates the Pp statistic using either the Z-Score method (default) or the ISO method, depending on the settings that are selected in . The following formulas are based on the default tolerance of K = 6, which is 6 standard deviations wide (3 standard deviations on each side of the process mean).
Z-Score method
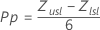
Notation
| Term | Description |
|---|---|
| Zlsl | Φ–1(p1) |
| Zusl | Φ–1(p2) |
| Φ–1(p) | p * 100th percentile of a standard normal distribution |
| p1 | Prob (X ≤ LSL) |
| p2 | Prob (X ≤ USL) |
| X | X follows the distribution used in the analysis |
ISO method
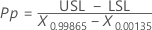
Notation
| Term | Description |
|---|---|
| USL | Upper specification limit |
| LSL | Lower specification limit |
| X0.99865 | The 99.865th percentile for the specified distribution |
| X0.00135 | The 0.135th percentile for the specified distribution |
PPL
PPL is calculated using the parameter values that you specify or is estimated using maximum likelihood method for a distribution used in the analysis. Minitab calculates the PPL statistic using either the Z-Score method (default) or the ISO method, depending on the settings that are selected in . The following formulas are based on the default tolerance of K = 6, which is 6 standard deviations wide (3 standard deviations on each side of the process mean).
Z-Score method
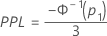
Notation
| Term | Description |
|---|---|
| Φ–1(p) | p * 100th percentile of a standard normal distribution |
| p1 | Prob (X ≤ LSL) |
| X | X follows the distribution used in the analysis |
ISO method
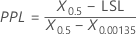
Notation
| Term | Description |
|---|---|
| LSL | Lower specification limit |
| X0.5 | The 50th percentile for the specified distribution |
| X0.00135 | The 0.135th percentile for the specified distribution |
PPU
PPU is calculated using the parameter values you specify or is estimated using maximum likelihood method for a distribution used in the analysis. Minitab calculates the PPU statistic using either the Z-Score method (default) or the ISO method, depending on the settings that are selected in . The following formulas are based on the default tolerance of K = 6, which is 6 standard deviations wide (3 standard deviations on each side of the process mean).
Z-Score method

Notation
| Term | Description |
|---|---|
| Φ-1(p) | p * 100th percentile of a standard normal distribution |
| p2 | Prob (X ≤ USL) |
| X | X follows the distribution used in the analysis |
ISO method
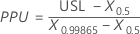
Notation
| Term | Description |
|---|---|
| USL | Upper specification limit |
| X0.5 | The 50th percentile for the specified distribution |
| X0.99865 | The 99.865th percentile for the specified distribution |
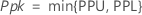
Ppk