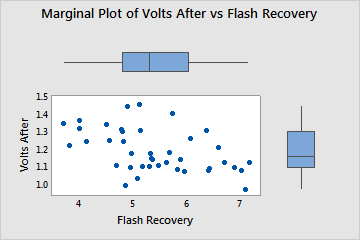
Use Marginal Plot to assess the relationship between two variables and examine their distributions. A marginal plot is a scatterplot that has histograms, boxplots, or dotplots in the margins of the x- and y-axes.
For example, a quality engineer for a camera manufacturer creates a marginal plot to examine the relationship between flash recovery time (minimum time between flashes) and the voltage remaining in a camera battery.
Where to find this graph
To create a marginal plot, choose .