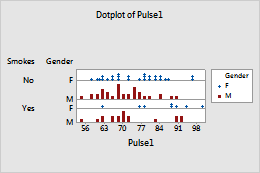
When you create a dotplot with groups, Minitab displays the data for different groups in different panels. You can also represent groups with different symbols and colors. When you create the graph, click Data View and enter the variables in Categorical variables for attribute assignment. For information on how to change the way groups are displayed on an existing dotplot, go to Symbols and dots and click "Dots on dotplots".
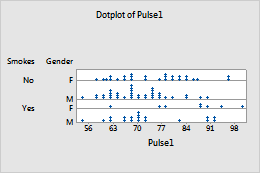
Default