In This Topic
S

Notation
| Term | Description |
|---|---|
| MSE | mean square error |
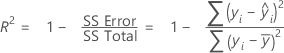
R-sq
R2 is also known as the coefficient of determination.
Formula
Notation
| Term | Description |
|---|---|
| yi | i th observed response value |
 | mean response |
 | i th fitted response |
R-sq (adj)
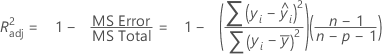
While the calculations for adjusted R2 can produce negative values, Minitab displays zero for these cases.
Notation
| Term | Description |
|---|---|
 | ith observed response value |
 | ith fitted response |
 | mean response |
| n | number of observations |
| p | number of terms in the model |
R-sq (pred)
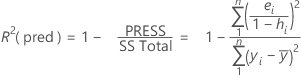
While the calculations for R2(pred) can produce negative values, Minitab displays zero for these cases.
Notation
| Term | Description |
|---|---|
| yi | i th observed response value |
 | mean response |
| n | number of observations |
| ei | i th residual |
| hi | i th diagonal element of X(X'X)–1X' |
| X | design matrix |
PRESS
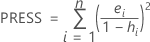
Notation
| Term | Description |
|---|---|
| n | number of observations |
| ei | ith residual |
| hi | ith diagonal element of X (X' X)-1X' |
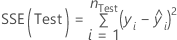
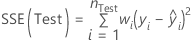
Test S
Formula

where
 .
.
For regression,

and for weighted regression
 .
.
Notation
| Term | Description |
|---|---|
 | number of rows in the test data set |
 | ith observed response value in the test data set |
 | ith fitted value for the response in the test data set |
 | weight for the ith observation in the test data set |
Test R-sq
Formula

where for regression
and for weighted regression
 .
.
The formula for the total sums of squares also depends on whether the data include weights. For regression,
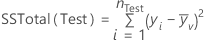

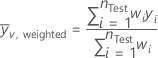
Notation
| Term | Description |
|---|---|
 | number of rows in the test data set |
 | ith observed response value in the test data set |
 | ith fitted value for the response in the test data set |
 | weight for the ith observation in the test data set |
 | mean of the response for the test data set |
 | weighted mean of the response for the test data set |
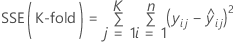
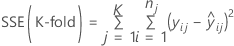
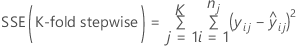
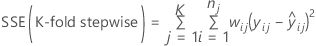
K-fold S
Formula

where
 .
.
For regression,
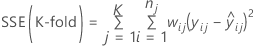
and for weighted regression
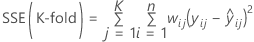 .
.
Notation
| Term | Description |
|---|---|
 | number of rows in fold j |
 | ith observed response value in fold j |
 | ith cross-validated fitted value for the response in fold j |
| K | number of folds |
| wi | weight for the ith observation in fold j |
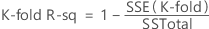
K-fold R-sq
Formula
Minitab calculates the sum of squares for error for each fold. These calculations use the same model terms for every fold, but the estimates of the coefficients can differ. To calculate the k-fold R2 statistic, sum the sums of squares for error from the different folds. For regression
and for weighted regression
 .
.
Then, the following formula gives the equation for k-fold R2:
Notation
| Term | Description |
|---|---|
 | number of rows without missing values for the response or missing values for the predictors that form the candidate terms in the model |
 | ith observed response value in fold j |
 | ith cross-validated fitted value for the response in fold j |
| K | number of folds |
| wij | weight for the ith observation in fold j |
| SSTotal | total sum of squares for all of the data |
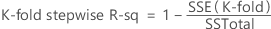
K-fold stepwise R-sq
Formula
Minitab calculate k-fold stepwise R-sq when the stepwise selection method is forward selection with validation and the validation method is k-fold cross-validation. Minitab performs forward selection K times, omitting the data for each fold once. The model for each fold can be different. Once the forward selection procedures are complete, Minitab sums the squared errors for all folds at each step. Minitab uses this sum to calculate k-fold stepwise R-sq. For regression:
and for weighted regression:
Then, the following formula gives the k-fold stepwise R2 value for a step.
Notation
| Term | Description |
|---|---|
 | number of rows without missing values for the response or missing values for the predictors that form the candidate terms in the model |
 | ith observed response value in fold j |
 | ith cross-validated fitted value for the response in fold j |
| K | number of folds |
| wij | weight for the ith observation in fold j |
| SSTotal | total sum of squares for all of the data |
Log-likelihood


Observations with weights of 0 are not in the analysis.
Notation
| Term | Description |
|---|---|
| n | the number of observations |
| R | the sum of squares for error for the model |
| wi | the weight of the ith observation |
AICc (Akaike's Corrected Information Criterion)

AICc is not calculated when  .
.
Notation
| Term | Description |
|---|---|
| n | the number of observations |
| p | the number of coefficients in the model, including the constant |
BIC (Bayesian Information Criterion)

Notation
| Term | Description |
|---|---|
| p | the number of coefficients in the model, including the constant |
| n | the number of observations |
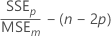
Mallows' Cp
Notation
| Term | Description |
|---|---|
| SSEp | sum of squared errors for the model under consideration |
| MSEm | mean square error for the model with all candidate terms |
| n | number of observations |
| p | number of terms in the model, including the constant |