In This Topic
With Histograms
Create a scatterplot with histograms of the x and y variables in the margins. For example, the following marginal plot shows the relationship between volts remaining in a camera battery after a flash and the flash recovery time, with histograms of the two variables in the margins of the graph.
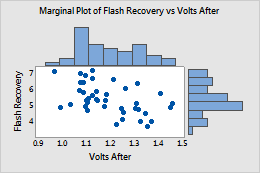
For more information, go to Create a marginal plot with histograms.
With Boxplots
Create a scatterplot with boxplots of the x and y variables in the margins. For example, the following marginal plot shows the relationship between volts remaining in a camera battery after a flash and the flash recovery time, with boxplots of the two variables in the margins of the graph.
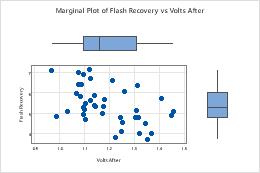
For more information, go to Create a marginal plot with boxplots.
With Dotplots
Create a scatterplot with dotplots of the x and y variables in the margins. For example, the following marginal plot shows the relationship between volts remaining in a camera battery after a flash and the flash recovery time, with dotplots of the two variables in the margins of the graph.
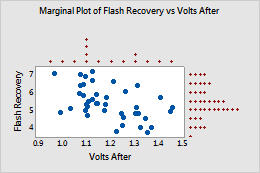
For more information, go to Create a marginal plot with dotplots.