A manufacturer uses short runs to create small batches of metal parts. The quality manager measures parts from three runs to assess the stability of the stamping process.
The manager creates a Z-MR chart to monitor the stamping process.
- Open the sample data, StampedParts.MTW.
- Choose .
- In Variables, enter Stamp Data.
- In Part indicator, enter Run.
- Click Z-MR Options.
- On the Estimate tab, under How to define groups of observations, select Relative to size (combine all observations, use ln).The quality engineer knows from experience that the variance increases as the size of the measurement increases. Therefore, use the Relative to size (combine all observations, use ln) method to estimating the process standard deviation.
- On the Tests tab, select 1 point > K standard deviations from center line (Test 1) and K points in a row on same side of center line (Test 2).If you are not sure which tests apply in your specific situation, use Tests 1, 2, and 7 when you first establish the control limits based on your data. After the control limits are established, you can use the known values of those limits and Test 7 is no longer needed.
- Click OK in each dialog box.
Interpret the results
Point 13 is above the upper control limit on the Moving Range chart. Also, Run A appears to have less variation in the moving ranges, than either Run B or Run C. You can see that variation across runs in the Z chart as well. Based on these results, special causes may currently influence the process.
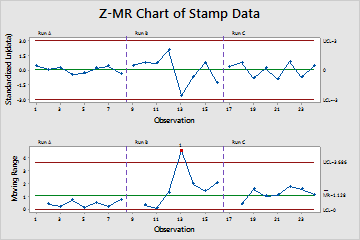
Z-MR Chart of Stamp Data
Test Results for MR Chart of Stamp Data
TEST 1. One point more than 3.00 standard deviations from center line.
Test Failed at points: 13
* WARNING * If graph is updated with new data, the results above may no longer
be correct.