In This Topic
Step 1: Determine sample size and acceptance criteria for a sampling plan
When you create an acceptance sampling plan, you must determine how many items to inspect from a lot of product, and determine when to accept or reject a lot of data based on the sample measurements.
Using your specifications for lot size, AQL, RQL, producer's risk (α), consumer's risk (β), and the specifications for your process, Minitab determines an appropriate sampling plan with a specific sample size and critical distance.
The critical distance is the value that Minitab uses to compare with the sample mean and specification limits to determine whether to accept or reject a lot.
After you collect your sample measurements, you will compare the Z values that are calculated from the mean and standard deviation to the critical distance and decide whether to accept or reject the entire lot.
Key Results: Sample Size, Critical Distance
In these results, the sample size is 104. You must sample 104 items from the entire lot of product. Minitab uses the lower specification of 0.09 inches to determine the critical distance to be 3.5570.
Note
If you had an upper specification, you need to consider that criteria, as well, and accept if (upper specification – mean) / standard deviation is ≥ 3.55750. Both of these criteria must be true, or you should reject the entire lot.
Step 2: Compare the probability of accepting or rejecting lots from alternative plans
After you create an acceptance sampling plan, you can vary the sample size and critical distances to reduce overall sample size.
You can compare plans by varying the sample size, the critical distance, or both together, and examine how the risks of acceptance vary.
Acceptance Sampling by Variables - Create/Compare
Lot quality in defectives per million
Key Results: Probability Accepting, Probability Rejecting
The plan with a sample size of 104 items and a critical distance of 3.5575 best matches the target α risk of 5% at the AQL and target β risk of 10% at the RQL. The plan that reduces the sample size slightly to 100 items also matches the target risk levels.
The plan with a sample size of 75 and a critical distance of 3.5575 also has an acceptable risk. However when the sample size is 50 and the critical distance is 3.5575, the probability of accepting at the AQL (0.873) is too low and the probability at accepting at the RQL (0.187) is too high.
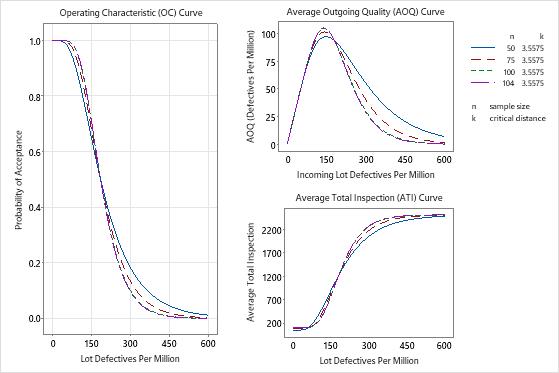
The acceptance sampling graphs help you visually compare sampling plans.
In these results, you could easily decide to reduce the sample size from 104 items to 100 items. The probability of acceptance at the AQL and the RQL changes by less than 0.5% (0.95 – 0.947). You might also decide to reduce the sample size to 75 or to rerun the analysis and choose a sample size between 75 and 100.