Create a plot that shows a single distribution with the parameters that you specify.
- Choose .
- Select the distribution and enter the parameters for the distribution. For more information, go to Select the distribution and parameters.
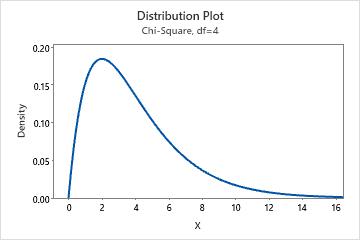
For example, this plot shows a chi-square distribution with 4 degrees of freedom.