A plant fertilizer manufacturer wants to develop a formula of fertilizer that yields the most increase in the height of plants. To test fertilizer formulas, a scientist prepares three groups of 50 identical seedlings: a control group with no fertilizer, a group with the manufacturer's fertilizer, named GrowFast, and a group with fertilizer named SuperPlant from a competing manufacturer. After the plants are in a controlled greenhouse environment for three months, the scientist measures the plants' heights.
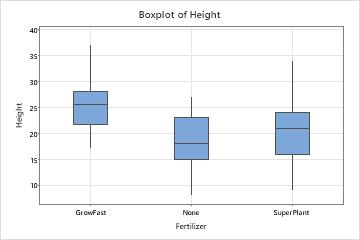
As part of the initial investigation, the scientist creates a boxplot of the plant heights from the three groups to evaluate the differences in plant growth between plants with no fertilizer, plants with the manufacturer's fertilizer, and plants with their competitor's fertilizer.
- Open the sample data, PlantGrowth.MTW.
- Choose .
- In Graph variables, enter Height.
- In Categorical variables for grouping (1-4, outermost first), enter Fertilizer.
- Click OK.
Interpret the results
GrowFast produces the tallest plants overall. SuperPlant also increases plant height, but its variability is greater, and SuperPlant does not have a positive effect on a large proportion of the seedlings. The graph shows that GrowFast causes a greater and more consistent increase in plant height.