What is an outlier?
An outlier is an unusually large or small observation. Outliers can have a disproportionate effect on statistical results, such as the mean, which can result in misleading interpretations. For example, a data set includes the values: 1, 2, 3, and 34. The mean value, 10, which is higher than the majority of the data (1, 2, 3), is greatly affected by the extreme data point, 34. In this case, the mean value makes it seem that the data values are higher than they really are. You should investigate outliers because they can provide useful information about your data or process. Often, it is easiest to identify outliers by graphing the data.
Using graphs to identify outliers
On boxplots, Minitab uses an asterisk (*) symbol to identify outliers. These outliers are observations that are at least 1.5 times the interquartile range (Q3 – Q1) from the edge of the box.
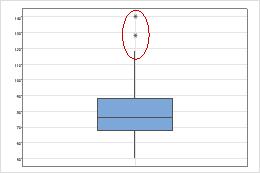
This boxplot shows two outliers.
On scatterplots, points that are far away from others are possible outliers.
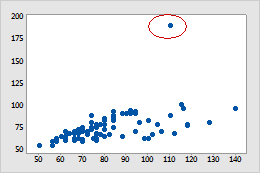
This scatterplot shows one possible outlier.
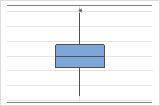
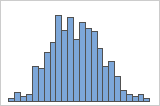
In some cases, you should examine more than one type of graph because outliers that show up on one graph may not be obvious on a different graph. The boxplot and histogram use the same data. The outlier is obvious in the boxplot, but not as obvious on the histogram.
Typical causes of outliers
| Cause | Possible actions |
|---|---|
| Data-entry error | Correct the error and re-analyze the data. |
| Process issue | Investigate the process to determine the cause of the outlier. |
| Missing factor | Determine whether you failed to consider a factor that affects the process. |
| Random chance | Investigate the process and the outlier to determine whether the outlier occurred by chance; conduct the analysis with and without the outlier to see its impact on the results. |