In This Topic
Step 1: Check your data for problems
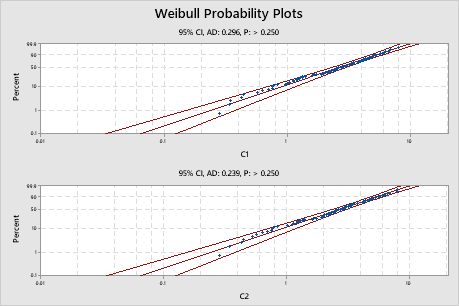
Your process should be stable and the process data should follow the nonnormal distribution chosen for the analysis. The probability plots allow you to evaluate the distribution fit.
Use the probability plots to assess the fit of the nonnormal distribution for each variable.
If the distribution is a good fit for the data, the points should form an approximately straight line. Departures from this straight line indicate that the fit is unacceptable. If the p-value is greater than 0.05, you can assume that the data follow the nonnormal distribution used in the analysis.
If the p-value is less than 0.05, your data do not follow the selected distribution and the capability analysis results may not be accurate. Use Individual Distribution Identification to determine which nonnormal distribution or data transformation is more effective for your data. If the distributions differ for different variables or groups, you should perform a separate capability analysis for each variable or group with a different distribution.
Key Result: P-value
In these plots, the points in both plots fall in an approximately straight line along the fitted (middle) line. Both p-values are greater than 0.250, so you do not have enough evidence that the data for either variable does not follow the selected nonnormal distribution (Weibull). Therefore, you can evaluate these data with nonnormal capability analysis using the Weibull distribution.
Important
The probability plots do not indicate whether your process is stable. To verify process stability, you should evaluate your data using a control chart. For more information, go to Overview for Nonnormal Capability Sixpack.
Step 2: Examine the observed performance of your process
For each group or variable in your data, use the capability histogram to examine the sample observations in relation to the process requirements.
Examine the process spread
For each variable, visually examine the data in the histogram in relation to the lower and upper specification limits. Ideally, the spread of the data is narrower than the specification spread, and all the data are inside the specification limits. Data that are outside the specification limits represent nonconforming items.
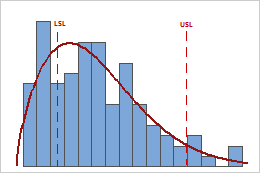
In this histogram, the process spread is larger than the specification spread, which suggests poor capability. Although much of the data are within the specification limits, there are many nonconforming items below the lower specification limit (LSL) and above the upper specification limit (USL).
Note
To determine the actual number of nonconforming items in your process, use the results for PPM < LSL, PPM > USL, and PPM Total. For more information, go to All statistics and graphs.
Assess the location of the process
For each variable, evaluate whether the process is centered between the specification limits or at the target value, if you have one. The peak of the distribution curve shows where most of the data is located.
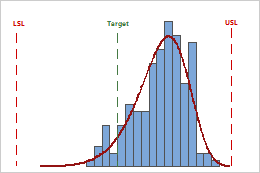
In this histogram, although the sample observations fall inside of the specification limits, the peak of the distribution curve is not on the target. Most of the data exceed the target value and are located near the upper specification limit.
Step 3: Evaluate the capability of the process
Use Ppk to evaluate the overall capability of your process based on both the process location and the process spread. Overall capability indicates the actual performance of your process that your customer experiences over time.
Generally, higher Ppk values indicate a more capable process. Lower Ppk values indicate that your process may need improvement.
Compare Ppk to a benchmark value that represents the minimum value that is acceptable for your process. Many industries use a benchmark value of 1.33. If Ppk is lower than your benchmark, consider ways to improve your process.
For each variable in your analysis, compare the Ppk value to determine if the overall capability of the process differs for different groups or under different conditions.
Key Result: Ppk
The process data in this histogram was collected prior to a process improvement. For these data, Ppk = 0.44. Because Ppk is less than 1.33, the overall capability of the process does not meet customer requirements. You should take steps to improve the process.
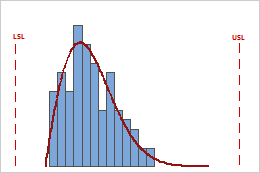
The process data in this histogram was collected after the process improvement. For these data, Ppk = 1.59. Because Ppk is greater than 1.33, the overall capability of the process now meets customer requirements.
CAUTION
The Ppk index represents the process capability for only the "worst" side of the process measurements, with respect to either the lower or the upper specification limit. If your process produces nonconforming items that fall outside both the lower and upper specification limits, use additional capability measures in the output to more fully assess process performance. For more information, go to All statistics and graphs.