Prep your data
Open your data source
- From the Solution Center home page, select Data Prep.
- Select Add Data. Sign into an online repository. You can also add a local data file.
- Browse to the file location, then select Open.
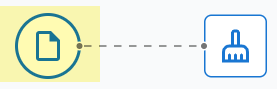
- Cleanup view
- You can begin cleaning your data when you are in the Cleanup view.
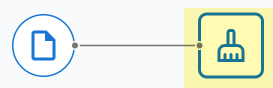
- Data Source view
- If you need to change the dataset schema or any settings that affect
the entire dataset, select the data source file icon to open the
Options panel.
For more information, go to Edit the dataset schema or Set data source options.
Data prep steps
- Open Insurance Fraud Data in the Minitab Data Center.
- Make sure you are in the Cleanup view.
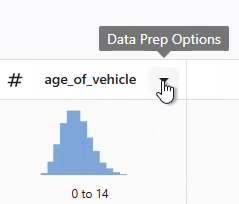
- Select the column and open the Data Prep Options dropdown menu to access the column cleanup options.
- For claim_number, change the data type from numeric to text.
- For claim_number, prepend # to the column values.
- For age_of_driver, filter to only include drivers that are less than or equal to 100 years old.
- In gender, change M to male and F to female.
- For annual_income, filter to only include drivers that make more than 1.
- For address_change, change the data type from numeric to text.
- In address_change, change 1 to yes and 0 to no.
- For zip code, change the data type from numeric to text.
- Use Advanced Sort to sort by fraud, injury claim, and ZIP code.
Use Minitab AI to clean your data
The Minitab Data Center provides a conversational interface that guides your data preparation, while in the Cleanup view. For the example above, you can enter the following text into the Minitab AI prompt to get the same results as invidual steps.
Make claim numbers to text. Add the number symbol to claim numbers. Remove drivers that are older than one hundred. Change m to male and f to female. Remove drivers that don’t have a valid income. Change address_change to text. Make 1 to yes and 0 to no for address changes. Sort by fraud, injury claim, and zip code.
For more information on using Minitab AI in the Data Center, go to Using Minitab AI to clean your data.
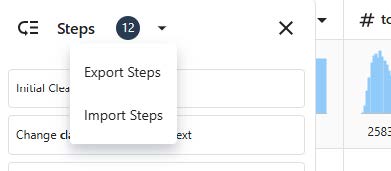
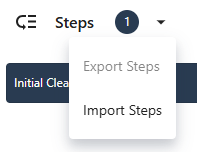
Export data prep steps
- In the Steps pane on the left, select Export Steps from the dropdown menu.
- The file is saved to your downloads folder or other save location and uses the same name as your data file. Change the name accordingly.
Import data prep steps
Explore data summaries
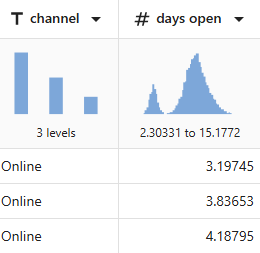
A quick look at the column graphical summaries show that channel has 3 levels and days open shows a bimodal distribution.
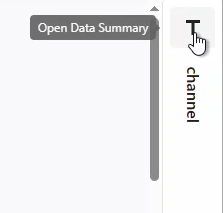
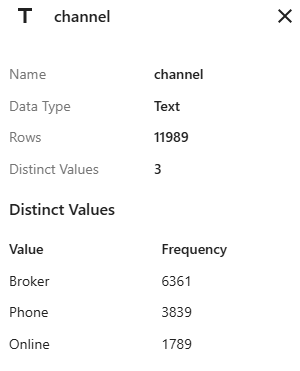
The data summary for channel shows the frequency for each of the 3 levels.
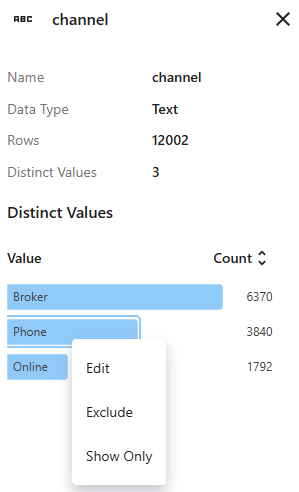
Use the right-click menu to edit the grouping label, exclude the group from the dataset, or show only the rows that contain this value.
What's next
Because the data for days open indicate two distributions, the insurance company wants to look at this further. Go to Analyze your data.