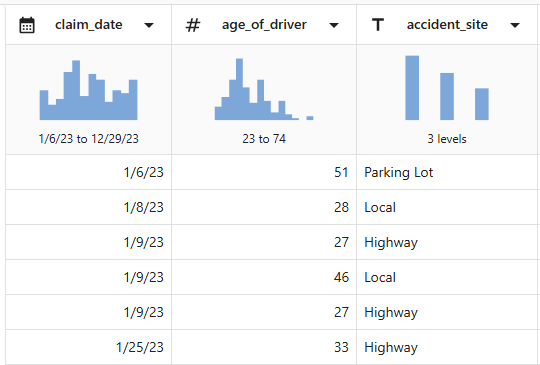
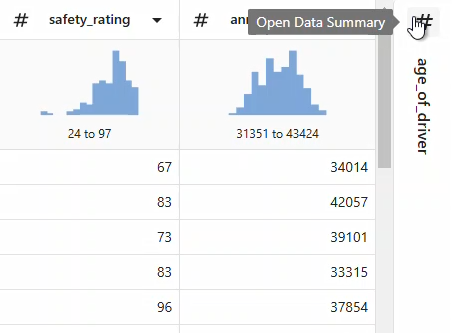
Each column has a summary that shows the shape of the data, the range of the data,
and an icon that represents the data type.
Open the Data Summary to get more information on the summary statistics of a column.
Use graphical summaries to filter data
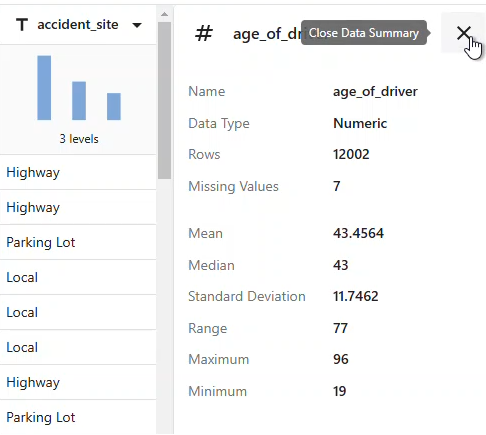
Numeric columns
The data summary for numeric columns includes the following summary
statistics.
number of rows
number of missing values
mean
median
standard deviation
range
maximum
minimum
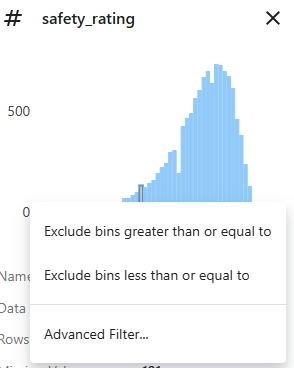
Hover over the histogram bins to see the specific bin information.
Right-click the bin of interest, then choose to exclude bins greater
than or less than this cutpoint.
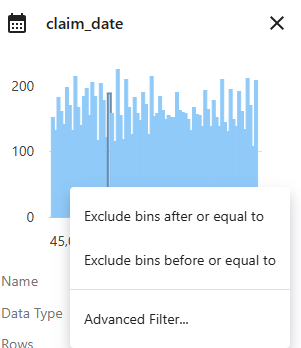
Date/time columns
The data summary for date/time columns includes the following summary
statistics.
number of rows
number of distinct values
number of missing values
the earliest date
the latest date
Hover over the histogram bins to see the specific bin information.
Right-click the bin of interest, then choose to exclude bins after or
before this cutpoint.
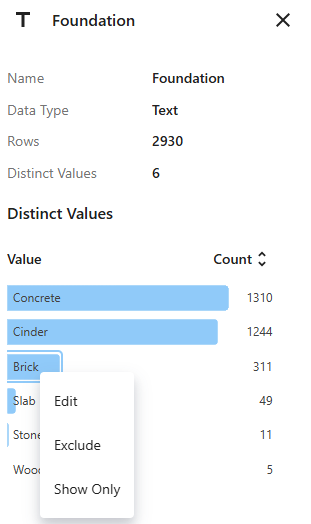
Text columns
The data summary for date/time columns includes the following summary
statistics.
number of rows
number of distinct values
bar chart with each value
Hover over the histogram bins to see the specific bin information.
Right-click the bar of interest, then choose to edit the grouping
label, exclude the group from the dataset, or show only the rows that
contain this value.