Equation syntax and functions
Equation syntax
Open Add column then select Calculated Column. You can either type an equation or insert functions and columns. The basic syntax information for all the supported functions are given in the following sections. For more information on any of the following functions, go to Calculator functions on the Minitab support site.
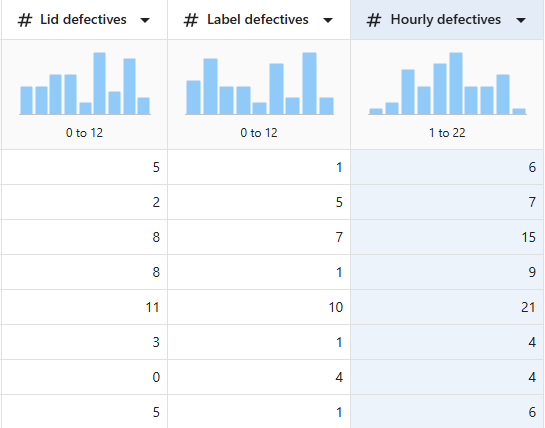
Example 1: Calculate hourly defectives
- Open your dataset in the Minitab Data Center.
- Open from the title bar.
- In New Column Name, enter Hourly defectives.
- In Equation, enter ='Lid defectives' + 'Label defectives'.
- Select OK.
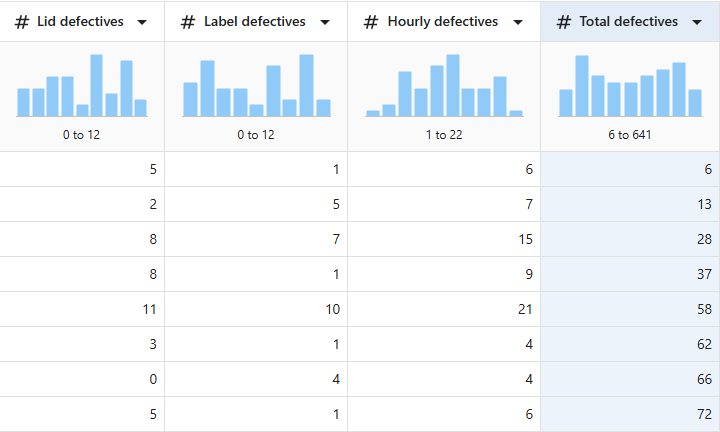
Example 2: Calculate a running total
- Reopen .
- In New Column Name, enter Total defectives.
- Under Insert Function, select Partial sum.
- Under Insert Column, select Hourly defectives.
=PARS('Hourly defectives')
- Select OK.
Arithmetic functions
- ABS(number)
- The absolute value function changes all negative numbers to positive numbers. Positive numbers and zero are unchanged.
- CEIL(number,decimals)
- The ceiling function rounds a number up based on the number of decimal
places you specify.For number, specify the number or column of numbers you want to round. For decimals, specify the number of places to round to.
- If decimals = 0, the number is rounded to the nearest integer greater than or equal to the number.
- If decimals > 0, the number is rounded up to the specified number of decimal places after the decimal point.
- If decimals < 0, the number is rounded up to 1 minus the specified number of place values to the left of the decimal point.
- COMBINATIONS(number of items, number to choose)
- The combinations function calculates the number of combinations of n items
chosen k at a time. This function is used in the formula to calculate the
probability of observing k events (successes) in n trials in an experiment
with only two outcomes (a binomial experiment).
Specify a number or column for the number of items and the number to choose. The number of items must be greater than or equal to 1, and the number to choose must be greater than or equal to 0.
- FACTORIAL(number of items)
- The factorial function calculates the product of all the consecutive
integers from 1 to n, inclusive. The notation ! is used to represent the
factorial. For example, 5! = 1* 2 * 3 * 4 * 5 = 120. By definition, 0! =
1.
The value of number of items must be greater than or equal to 0. You can enter a column or constant. Missing values are not allowed.
- FLOOR(number,decimals)
- The floor function rounds a number down based on the number of decimal
places you specify.For number, specify the number or column of numbers you want to round. For decimals, specify the number of places to round to:
- If decimals = 0, the number is rounded to the nearest integer less than or equal to the number.
- If decimals > 0, the number is rounded down to the specified number of decimal places after the decimal point.
- If decimals < 0, the number is rounded down to 1 minus the specified number of place values to the left of the decimal point.
- GAMMA(shape), IGAMMA(limit,shape), LNGAMMA(shape)
- The Gamma, Incomplete gamma, and Natural log of gamma functions extend the
factorial function (1 * 2 * 3...* n) so that factorials can be calculated
for fractions in addition to positive integers. The Natural log of gamma
function is sometimes used in calculations instead of the gamma function
because the Natural log of gamma is less likely to generate very large
numbers that can be larger than the storage capability and cause
overflow.
For shape, specify the number you want to take the function of. For limit, specify the upper limit of the integral.
- MOD(number,divisor)
- The modulo function calculates the remainder after a number is divided by a
divisor. In standard notation, the result is expressed as m = (MOD result)
(mod n). For example, the result of MOD(23,10) is expressed as 23 = 3 (mod
10).
The number and divisor must be integers or columns of integers.
- PARP(number)
- The partial products function stores the product of the first i rows of the input column in the ith row of the storage column. For example, if the first three rows of the input column C1 contain the values 2, 5, and 3, then the first three rows of the storage column will contain 2 (equal to 2 * 1), 10 (2 * 5), and 30 (2 * 5 * 3).
- PARS (number)
- The partial sums function calculates the running total for the numbers in a column by storing the sum of the first i rows of the input column in the ith row of another column.
- PERMUTATIONS (number of items, number to choose)
- The Permutations function finds the number of permutations of n items chosen
k at a time. Permutations are used to calculate the probability of an event
in an experiment with only two possible outcomes (binomial
experiment).
Specify a number or column for the number of items and the number to choose. The number of items must be greater than or equal to 1, and the number to choose must be greater than or equal to 0.
- ROUND(number,decimals)
- The round function rounds a number up based on the number of decimal places
you specify.For number, specify the number or column of numbers you want to round. For decimals, specify the number of places to round to.
- If decimals = 0, the number is rounded to the nearest integer.
- If decimals > 0, the number is rounded to the specified number of decimal places after the decimal point.
- If decimals < 0, the number is rounded to 1 minus the specified number of place values to the left of the decimal point.
- SIGN(number)
- The sign function converts negative numbers, zero, and positive numbers to
−1, 0, and +1, respectively. You can use the signs function to code the
numbers in a column. This function is useful in macros, formulas, and
nonparametric analyses.
For number, specify the number or column of numbers you want to convert.
- SQRT(number)
- The square root function calculates the square root of all nonnegative
numbers. For example, the square root of 25 = 5.
For number, specify the number or column of numbers. If you enter a negative number, Minitab returns a missing value.
- FTC(Count)
- The transform count function conducts the Freeman-Tukey transformation to
stabilize variance for Poisson data (counts). For example, you can transform
attribute data so that the assumptions of the regression or ANOVA model are
met.
For Count, specify a column or stored constant that contains only nonnegative integers.
- FTP(Trials,Events)
- The transform proportion function conducts the Freeman-Tukey transformation
to stabilize variance for binomial data. For example, you can transform
attribute data so the assumptions of the regression or ANOVA model are
met.
Specify the number of Trials and the number of Events; each can be a column or stored constant. Trials must be a positive integer. Events must be an integer between 0 and the number of trials, inclusive.
Column functions
- DIFFERENCES(number, [lag])
- The differences function calculates row-by-row differences between numeric
values in a column.
Specify the column, then the lag value to determine row-by-row differences. This function subtracts from each row the element lag rows above, and stores the differences in a new column. If you don't specify a value for lag, the differences are calculated between consecutive rows (lag = 1). The first lag rows of the new column will contain the missing value symbol *.
- LAG(number_or_text,[lag])
- The lag function copies the data in the input column to the storage column,
moving each value down by the numbers of rows you specify.
Specify the input column, then specify the number of rows the data should move down. By default, if no value is specified for lag, the data is moved down one row (lag = 1). Missing value symbols * are added in the empty rows of the storage column.
- RANK(number)
- The rank function calculates and stores the ranks of the input column.
In number, specify the column. This function assigns rank scores to the values in the column: 1 to the smallest value, 2 to the next smallest, and so on. Ties are assigned the average rank for that value. Missing values are left as missing. Ranked scores are stored in a column.
- SORT(column)
- The sort function sorts the numerical values in a column in ascending order.
Ranked scores are stored in a column.
Specify the column to sort. Data must be numerical.
Date/time functions
- CTIME()
- The current time function returns the current time to a column with
date/time format.
For example, to calculate how long a service call has been open, use this expression: ELAPSED(CTIME () – column_name).
- DATE(number_or_text)
- The date function extracts the date portion of a date/time value. For example, the date portion of "1/6/25 10:23" is "1/6/25".
- ELAPSED(number)
- The elapsed time function returns the time that has elapsed between two
date/time values.
For number, enter the column with the end times minus the column with the start times. The columns must be in date/time format. The elapsed time is specified in minutes and seconds (mm:ss) if the maximum value of the output column is less than one hour; the elapsed time is specified in hours, minutes, and seconds (hh:mm:ss) if the maximum of the output column is an hour or more.
- NETWORKDAYS(start date,end date,[holidays])
- The net workdays function returns the number of workdays (M-F) between two
dates, inclusive.
When you enter single dates, you also need to use the DATE function. For example, to find out the number of workdays between 1/1/25 and 1/31/25, enter NETWORKDAYS (DATE("1/1/25"), DATE("1/31/25")).
- NOW()
- The now function returns the current date and time to a column with
date/time format.
For example, to calculate the number of days since the initial call was received, use this expression: NOW() – column_name).
- TIME(number_or_text)
- The time function extracts the time portion of a date/time value. For example, the time portion of "1/6/25 10:23" is "10:23".
- TODAY()
- The today function returns the current date to a column with date/time
format.
For example, to calculate how long a bill has been unpaid, use this expression: TODAY() – column_name).
- WHEN(number_or_text)
- The when function extracts the date and time portion of a date/time value, such as "01/06/25 10:23", to a column with date/time format.
- WDAY(start date,num workdays,[holidays])
- The workdays function offsets the date by the specified number of workdays.
This function is useful for quickly revising columns of date/time data in
the worksheet.
When you enter single dates, you also need to use the DATE function. For example, WDAY(DATE("1/1/25"),4) equals 1/7/2025.
Logarithm functions
- ANTILOG(number)
- The antilog function calculates 10n, where n is the specified number. For example, the antilog of 2 is 102 = 100.
- EXP(number)
- The natural exponential function calculates the value ex, where e is the base of the natural log equal to approximately 2.71828 and x is the value that you enter. For example, the exponential of 5 is e5, which equals about 148.413.
- LOGTEN(number)
- The log base 10 function calculates the exponent to which 10 must be raised
to equal a given number. For example, 102 = 100, so the log base
10 of 100 is 2.
Log base 10 is defined only for positive numbers. When you multiply a number by 10, you increase its log by 1; when you divide a number by 10, you decrease its log by 1.
- LN(number)
- The natural log (log base e) function calculates logarithms to the base e, where e is the constant equal to approximately 2.71828. The natural log of any positive number, n, is the exponent, x, to which e must be raised so that ex = n. For example, e2 = 7.389, so the natural log of 7.389 is 2.
Logical functions
- ANY(test,constant,constant,...)
- The ANY function returns a 1 if a value equals any value from a set of
values, returns a 0 if not.
For example, to identify instances of the value 3 in C1, enter the expression ANY(C1,3). Results are stored in the new column.
C1 New 6 0 3 1 2 0 3 1 3 1 - IF(test,value_if_true,[value_if_false])
- The IF function chooses which of two values to return based on whether a
condition is true or false.
For example, to change a column of 0's and 1's to "pass" and "fail", enter the expression IF(C1=1,"fail","pass"). Results are stored in the new column.
C1 New 0 pass 1 fail 0 pass 1 fail 1 fail - IF(test,value_if_true,...,test,value_if_true,[value_if_false])
- The IF (general) function returns a value for each of multiple conditions
evaluated sequentially.
For example, to convert the numbers 0-6 to ratings of "low", "medium" and "high", enter the expression IF(C1<=2,"low",C1<=4,"medium","high"). Results are stored in the new column.
C1 New 0 low 1 low 6 high 3 medium 2 low
Statistics functions
- GMEAN(number)
- The geometric mean function calculates the geometric mean, which is a
measure of central tendency that calculates an average of the data using
multiplication instead of addition.
For a set of n numbers, the geometric mean is the nth root of the product of those numbers. For example, the geometric mean of the numbers 2, 3, and 14 equals (2 * 3 * 14)1/3 = (84)1/3 = 4.37952.
- MAX(number) or MIN(number)
- Identifies the largest and smallest value of the data.
For example, calculate the maximum and/or minimum values down a column or across rows.
Column Calculator expression Result C1 contains 6, 3, 15 MAX(C1) 15 C1 contains 6, 3, 15 MIN(C1) 3 C1 contains 6, C2 contains 3, and C3 contains 15 RMAX(C1) 15 C1 contains 6, C2 contains 3, and C3 contains 15 RMIN(C1) 3 - MEAN(number) or RMEAN(number,number,...)
- The mean function calculates the arithmetic average (the sum of all the
observations divided by the number of observations).
For example, calculate the mean down a column or across rows.
Column Calculator expression Result C1 contains 6, 3, 15 MEAN(C1) 8 C1 contains 6, C2 contains 3, and C3 contains 15 RMEAN(C1,C2,C3) 8 - MEDIAN(number) or RMEDIAN(number,number,...)
- The median function calculates the middle value of the data: half the
observations are less than or equal to it and half the observations are
greater than or equal to it.
For example, calculate the median down a column or across rows.
Column Calculator expression Result C1 contains 6, 3, 15 MEDIAN(C1) 6 C1 contains 6, C2 contains 3, and C3 contains 15 RMEDIAN(C1,C2,C3) 6 - NMISS(number) or RMISS(number)
- The total nonmissing function calculates the total number of cells that contain missing data.
- N(number) or RN(number)
- The total nonmissing function calculates the total number of cells that contain actual data.
- COUNT(number) or RCOUNT(number)
- The total count function calculates the total number of observations (sum of missing and nonmissing values).
- NSCORES(number)
- The normal scores function provides the expected values of the ordered data under normality. These scores can be used to produce normal probability plots and various tests.
- PERCENTILE(number,probability)
- The percentile function calculates the sample percentile for a specified
probability and set of numbers. Percentiles divide the dataset into parts.
Usually, the nth percentile has n% of the observations below it, and
(100-n)% of observations above it.
For example, to determine the 1st quartile (25th percentile) of a column of data, enter the column number and the probability 0.25.
Column Calculator expression Result C1 contains 2, 3, 5, and 7 PERCENTILE (C1,0.25) 2.25 - RANGE(number) or RRANGE(number,number,...)
- The range function calculates the difference between the maximum value and
the minimum value.
For example, calculate the range down a column or across rows.
Column Calculator expression Result C1 contains 6, 3, 15 RANGE(C1) 12 C1 contains 6, C2 contains 3, and C3 contains 15 RRANGE(C1,C2,C3) 12 - STDEV(number) or RSTDEV(number,number,...)
- The standard deviation function measures the dispersion (how spread out the
data are) about the mean. While the range estimates the spread of the data
by subtracting the minimum value from the maximum value, the standard
deviation approximately estimates the "average" distance of the individual
observations from the mean. The greater the standard deviation, the greater
the spread in the data.
For example, calculate the standard deviation down a column or across rows.
Column Calculator expression Result C1 contains 6, 3, 15 STDEV(C1) 6.245 C1 contains 6, C2 contains 3, and C3 contains 15 RSTDEV(C1,C2,C3) 6.245 - SUM(number) or RSUM(number,number,...)
- The sum function calculates the sum, which is the result of adding two or
more numbers.
For example, sum down a column or across rows.
Column Calculator expression Result C1 contains 6, 3, 15 SUM(C1) 24 C1 contains 6, C2 contains 3, and C3 contains 15 RSUM(C1,C2,C3) 24 - SSQ(number) or RSSQ(number,number,...)
- The sum of squares function squares each value and calculates the sum of
those squared values. That is, if the column contains x 1, x 2, ... , x n,
then sum of squares calculates (x12 + x22 + ... +
xn2).
For example, calculate the sum of squares down a column or across rows.
Column Calculator expression Result C1 contains 6, 3, 15 SSQ(C1) 270 C1 contains 6, C2 contains 3, and C3 contains 15 RSSQ(C1,C2,C3) 270
Text functions
- CLEAN(text)
- The clean function removes all nonprintable characters. Nonprintable characters may be embedded in text when you import text from external sources.
- CONCATENATE(text,text,...)
- The concatenate function combines two or more text columns side-by-side and stores them in a new column.
- FIND(find_text,within_text,[start_num])
- The find function identifies the starting position of a string of text
within a different string of text. Find is similar to Search, except Find is
case-sensitive; for example, it distinguishes between b and B.
You can use an asterisk (*) as a wildcard character that represents a string of one or more characters. The question mark (?) is also a wildcard character, but it represents only one character instead of a string of characters. To reference the "*" or "?" character within a text string, use the tilde (~) before the symbol.
- FIXED(number,[decimals],[no_commas])
- The fixed function rounds a number to the specified number of decimals and
converts it to text with or without commas.For number, specify the number or column of numbers you want to round. For decimals, specify the number of places to retain.
- If decimals = 1, value rounds to the nearest tenth.
- If decimals = 0, value rounds to the nearest integer.
- If decimals = -1, value rounds to a multiple of ten.
- If you don't enter a second argument, value rounds to 2 decimal places.
- HTOD(text)
- The hex to decimal function converts hexadecimal values to their equivalent decimal form.
- ITEM(text,word_num,[delimiters])
- The item function extracts the nth word from a string of text.
For example, if you have a column of last names and first names separated by a comma, you can extract all characters from the beginning of the text string up to the comma, which are the last names.
- LEFT(text,num_chars) or RIGHT(text,num_chars) or MID(text,start_num,[num_chars])
- The left function returns the specified number of characters from the beginning of a string of text. The right function returns the specified number of characters from the end of a string of text. The mid function returns a substring of characters within a string of text, given the starting position and the length of the substring.
- LEN(text)
- The length function identifies the number of characters in a string of text.
- UPPER(text) or LOWER(text) Or PROPER(text)
- The upper function converts all letters to uppercase (capital letters). The
lower function converts all letters to lowercase. The proper function
capitalizes the first letter in each word and converts all other characters
to lowercase.
Column Calculator expression Result C1 contains "defective" UPPER(C1) DEFECTIVE C1 contains "DEFECTIVE" LOWER(C1) defective C1 contains "defective" PROPER(C1) Defective - PAD(text,num_chars)
- The pad function pads text with trailing spaces. For text, specify the text or the column of text values. For num_chars, enter the total number of characters needed for the text and the trailing spaces. The padding is the total number of characters minus the number of characters in the text.
- REPT(text,number_times)
- The repeat function repeats text a specified number of times. For text, specify the text or the column of text. For number_times, specify how many times to repeat the text.
- REPLACE(old_text,start_num,num_chars,new_text) or SUBSTITUTE(text,old_text,new_text,[instance_num])
- The replace function replaces a substring of text within a string of text. The substitute function replaces existing text with new text and lets you specify which occurrence of the original text you want to replace if the text occurs more than once in a single entry.
- SEARCH(find_text,within_text,[start_num])
- The search function identifies the initial position of a string of text
within another string of text. Search is similar to Find, except that Search
is not case-sensitive; for example, it does not distinguish between b and B.
Column Calculator expression Result C1 contains "234B75" SEARCH("b7",C1) 4 (because B7 begins at the 4th position in the text) C1 contains "depreciate" SEARCH( "c*t",C1) 6 C1 contains "Item# C-222-T" SEARCH( "c*t",C1) 7 C1 contains "defective" SEARCH( "c*t",C1) 5 C1 contains "814*231*2682" SEARCH( "~*",C1) 4 - TEXT(number)
- The text function converts a numeric or date/time column or value to a text column. Converting numeric values to text lets you edit and manipulate the values using text manipulation functions.
- TRIM(text)
- The trim function removes all spaces except single spaces between words.
- VALUE(text)
- The value function converts a text column containing numbers into a numeric column. After you convert a column of numbers into a numeric column you can perform mathematical operations on the data.
- WORD(text,word_num,[delimiters])
- The value function extracts the nth word from a string of text. For example,
if you have a column of last names and first names separated by a comma, you
can extract all characters from the beginning of the text string up to the
comma, which are the last names.
Note
The Word function is similar to the Item function, except that Item extracts the empty text that occurs between consecutive separators (such as the comma and space) while the Word function ignores the empty string and extracts the text that follows the consecutive separators.
Trigonometry functions
- ACOS(number)
- The arccosine function determines the angle corresponding to a specified
cosine. Arccosine is defined in radians from 0 to π.
For example, the arccosine of 0.5 is π/6 or 0.5230 radians. Arccosine (also called the inverse cosine) can be represented by cos−1 x, arccos x, or acos x.
- ACSH(number)
- The hyperbolic arccosine function calculates the hyperbolic arccosine of a value.
- ASIN(number)
- The arcsine function determines the angle corresponding to a specified sine.
Arcsine is defined in radians from −π/2 to π/2.
For example, the arcsine of 0.5 is π/6 or 0.5230 radians. Arcsine is also called the inverse sine and can be represented by sin−1 x, arcsin x, or asin x.
- ASNH(number)
- The hyperbolic arcsine function calculates the hyperbolic arcsine of a value.
- ATAN(number)
- The arctangent function determines the angle corresponding to a specified
tangent.
For example, the arctangent of 1 is the angle whose tangent equals 1, or the angle π/4 (0.785398 radians). Arctangent (also called inverse tangent) and can be represented by tan−1 x, arctan x, or atan x.
- ATNH(number)
- The hyperbolic arctangent function calculates the hyperbolic arctangent of a value.
- COS(angle in radians)
- The cosine of an acute angle of a right triangle is the ratio of the adjacent leg to the hypotenuse (the longest side, opposite the right angle), measured in radians.
- COSH(number)
- The hyperbolic cosine function calculates the hyperbolic cosine of an angle.
- DEGREES(angle in radians)
- The degrees function changes radians to degrees. Radians and degrees are units of measure used to identify the size of an angle. The angle measure in radians equals the length of an arc when the angle vertex is at the center of a unit circle.
- RADIANS(angle in degrees)
- The radians function changes degrees to radians. Trigonometric functions in this calculator require angle measures in radians. Radians and degrees are units of measure used to denote the size of an angle. The angle measure in radians equals the length of an arc when the angle vertex is at the center of a unit circle.
- SIN(angle in radians)
- The sine of an acute angle of a right triangle is the ratio of the opposite leg to the hypotenuse (the longest side, opposite the right angle), measured in radians.
- SINH(number)
- The hyperbolic sine function calculates the hyperbolic sine of an angle.
- TAN(angle in radians)
- The tangent of an angle is the ratio of its sine to its cosine. For an acute angle of a right triangle, this is equivalent to the ratio of the length of the opposite leg to the length of the adjacent leg, measured in radians.
- TANH(number)
- The hyperbolic tangent function calculates the hyperbolic tangent of an angle.
Row statistics functions
The syntax details for row statistics of maximum, mean, median, minimum, missing, nonmissing, total, range, standard deviation, sum, and sum of squares are above with the statistics functions.
Constants functions
- E()
- The e function inserts the constant e, rounded to six decimal places (2.718281). e is the base of the natural logarithm function. The constant e is an irrational number, and is defined by the infinite sum 1/0! + 1/1! + 1/2! + 1/3! + 1/4! + 1/5!...
- MISS()
- The missing data code function inserts the constant * (missing value symbol).
- PI()
- The pi function inserts the constant π, rounded to six decimal places (3.141592). Pi is the ratio of a circle's circumference to its diameter.