Applied
Filters use selections from dashboard assets to include or exclude data. Applied filters affect the
data used by all assets on the current page of the dashboard, not just the asset where you
make the selection. Applied filters are temporary and remain only for the current
session.
Note
You can create an applied filter only on a bar chart,
pie chart, and Pareto chart.
Make a selection
To select one item, right-click a bar or slice, then choose one of the following options.
You can also select these options from the More menu.
Keep Only This
Selection
Creates a filter that keeps only the selected data.
Exclude This
Selection
Creates a filter that excludes the selected data from the dashboard view.
Note
If you're unable to make a selection, open the dialog for
the graph and select Create to re-create the graph.
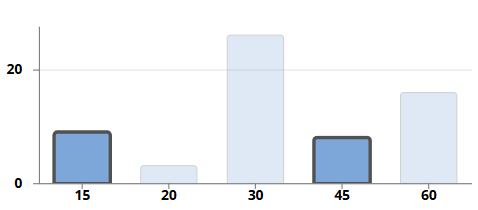
To select multiple items, use one of the following methods.
Select multiple separate items
Press Ctrl and left-click each item that you want to include
in the selection.
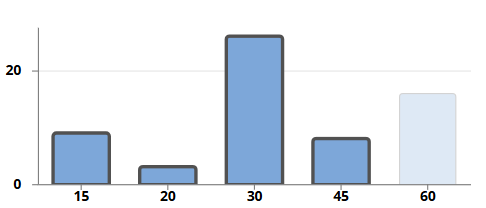
Select a range of items
Left-click an item and press Shift. Then left-click another
item to select a range of items. For bar charts, Pareto charts, and semi-circle pie
charts, Shift+click selects every item between the first and
second selected items. For circular pie charts, Shift+click
selects every slice from the first to the second selected slice in a clockwise
direction.
Bar chart with a selection of multiple separate items
Bar chart with a selection of a range of items
After you select the items, you can right-click the selection or select More to keep or
exclude the data in the selection.
Review and remove Applied
Filters
When you create an applied filter, it appears in the Filters pane, which
summarizes all active Slicer
Controls and Applied
Filters on the current page of the dashboard.
Select Clear
All to remove all filters, or select Clear to remove a
single filter.
 menu.
menu.