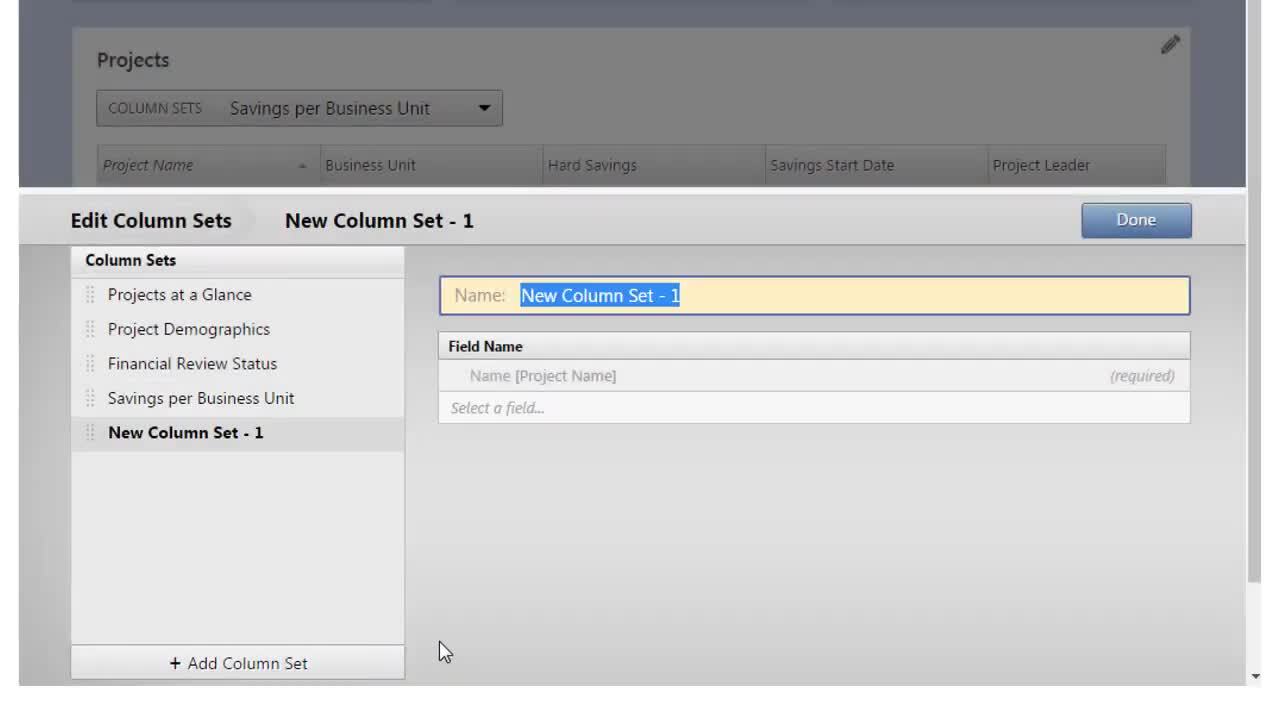
Create a new column set
You can have multiple column sets to show different groups of project data fields. For example, you might have one column set that contains only financial data fields and a different column set that contains only data fields related to project details, such as status, location, and health.
- Choose .
-
In edit mode, in the Projects section, select the edit
button
 to open the column set editor.
-
In the column set editor, select Add Column Set.
Note
In a project report, the first column of any column set is always Project Name. In a task report, the first two columns of any column set are always Project Name and Task Subject. You cannot delete, move, or rename these required columns.
- Enter a name for the column set, then select the data fields to add.
In the report, the new column set is available in the Column Sets drop-down list.
Edit an existing column set
To edit an existing column set, complete the following steps.
-
Select the edit button
 .
.
- From the list of column sets, select the column set to edit, then complete any of the following tasks.
- Change the name of a column.
- Add or delete data fields.
- Change the order of the columns. Select the
drag handle
 and drag the data
field up or down to change its location.
 - Add alerts.
Set conditions to add alerts to column sets
You can add alerts, such as colors or icons, to a column set to call attention to projects or tasks that are at risk or projects that have replication potential. To add an alert to a column set, set conditions on the data field that contains the criteria you want to highlight.
To set conditions, complete the following steps.
- Choose .
-
In edit mode, in the Projects section, select the edit button
 to open the column set editor.
- In the column set editor, select the column set to edit.
-
Beside the field to edit, select the edit button
 . For example, select
Actual Hard Savings to display an alert when savings are less than $100,000.
Note
To set conditions on a date field, you must select the Days Since Date or Days Until Date option. Then, you can set conditions. For example, you might indicate when more than 100 days have passed since the project started or when the project is due in less than 7 days.
- In the data field editor, select Conditional Formatting.
- Beside Display As, choose whether to display a color or an icon in the column set.
-
In the first row of the table, under Condition, select
 , then choose an option, for example, Less Than.
- Enter a value for the condition, for example, $100,000.
-
Depending on your selection in Step 6, select
 , then choose
an option to display when the condition is met, for example, a red circle
 .
.
- Optionally, enter a tooltip to display when the condition is met, for example, Low savings.
-
Continue to apply conditions for as many variables as needed for your
scenario.
- Engage evaluates multiple conditions from top to bottom in the order
they are listed. To change the order of the conditions, select the
drag handle
 and drag the condition up or down.
 - You can delete a condition without affecting other conditions in the list.
- Engage evaluates multiple conditions from top to bottom in the order
they are listed. To change the order of the conditions, select the
drag handle
- If an Otherwise row is available, you can choose a different icon or color to display when the conditions you specified are not met.
Watch a video
Watch a video to learn more about column sets.

