Open the dashboard
You can open the dashboard from the desktop app.
- Choose .
- Sign in to the web app. Use the email address and the password you created when you activated your Engage account.
Learn about the dashboard
The Engage dashboard summarizes project data into reports to give users and stakeholders information about the deployment. Dashboard reports allow you to see the aggregated data for key metrics across the deployment, as well as details such as status, phase, or the individual contributions of a single project.
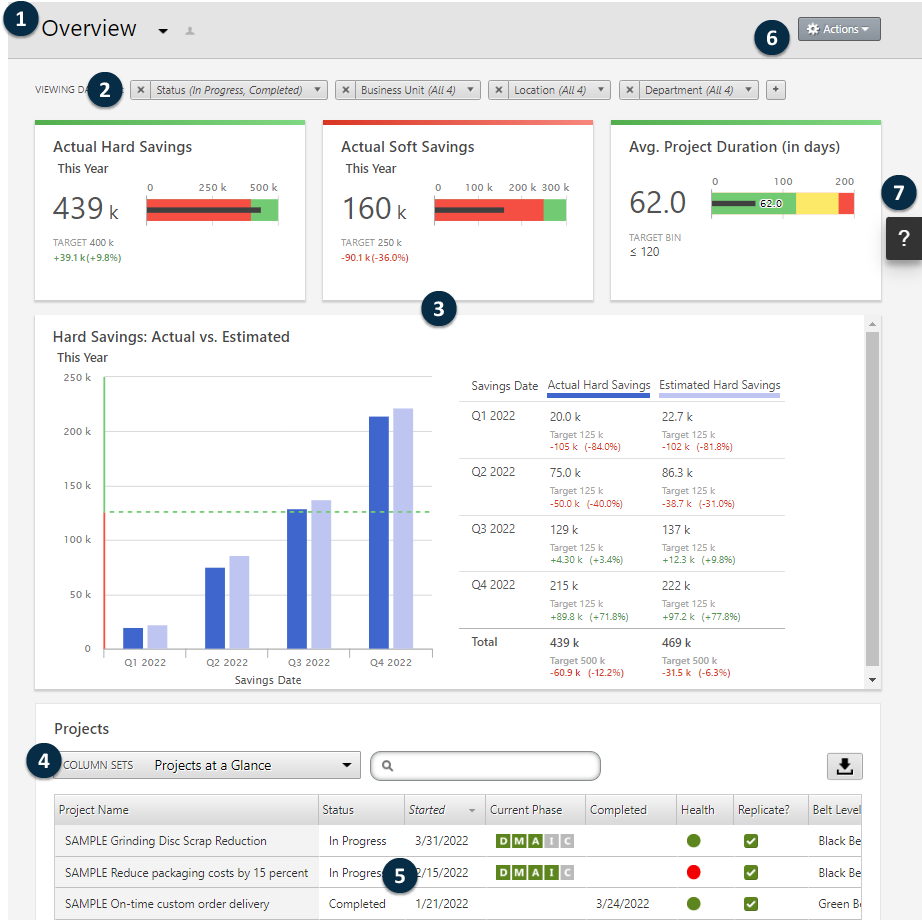
- 1: Reports list
- A list of available reports organized by private reports that you own, reports that are shared with you, and public reports.
- 2: Filters
- Allows you to focus on a subset of projects or tasks based on a condition, such as region, location, or project status.
- 3: Summaries
- Displays aggregate project or task data, such as the number of projects or tasks in each division or the average duration of projects or tasks. Summaries can also display optional targets.
- 4: Column sets
- Determines the fields that are displayed in the Projects or Tasks list.
- 5: Projects or Tasks list
- Displays a list of all projects or tasks that meet the criteria of the selected filters.
- 6: Actions menu
- Gives you access to common tasks, such as editing, copying, and creating new reports, saving a report as a PDF, and setting default reports.
- 7: Help button
- Opens the Help panel so you can access Help topics and instructional videos. From the Help panel on the Projects page, you can download the desktop app.
Learn about your view of the dashboard
Most reports on the dashboard are public. However, only data architects can create public reports. If you are a data architect, go to Create a report.
To personalize your view of a public report, you can apply filters. For example, you might want to filter a report by your business unit or location. For more information, go to Apply filters.
You can also create and share private reports. To save time, copy a public report that you like, then edit it to create a custom private report. For more information, go to What is edit mode? and Share a report.
What's next
For videos, how-to's, and glossary terms, go to Minitab Engage Support.