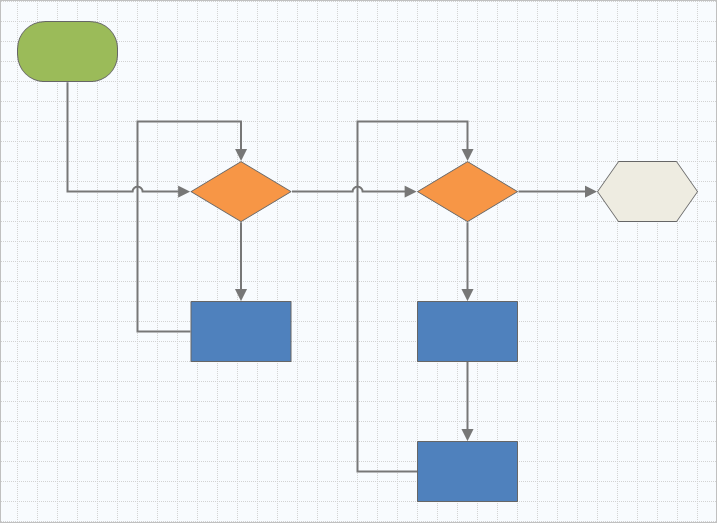
Use a process map to illustrate the sequential flow and the
relationship of steps in a process or procedure.
Process maps help you to understand and to communicate the activities, or
steps, in a process. Process maps also help you to see the relationship between
inputs and outputs in a process, identify key decision points, and uncover
rework loops.
A process map answers the following questions.
- Which areas of the process show the greatest opportunity for improvement?
- For a specific project, where does the process start and end?
- What are the inputs and outputs of each step in the process?
- Which steps are the bottlenecks and sources of defects?
- Which steps have a direct impact on customer requirements?
- Can you simplify, combine, or eliminate steps in the process?
How-to
- As a team, determine where the process starts and where it ends, then walk through each step of the process.
- Identify the data associated
with each step of the process. Consider the following items.
- Activities: Names of the steps in the process map.
- Inputs: X variables that can influence the output of interest, either directly or indirectly.
- Outputs: Y variables that depend on X variables.
- Process data: Information that further defines the characteristics of a process, such as the yield or DPMO at each step.
- Lean data: Information that is used to identify and eliminate waste, such as resource utilization or cycle time at each step.
- Record the collected information in a process map.
For more information, go to Add a map.