Reports are made up of summaries, which can be graphs, tables, or
both. Summaries can quickly show you the status of your entire initiative by
capturing trends and snapshots.
In This Topic
Trend summaries
A trend summary shows data over time, for example, year-to-date by month,
this year by quarter, a fixed date range by year, or a rolling date range by
month where you can set the number of months to show before or after the
current date. The following images show different types of trend summaries.
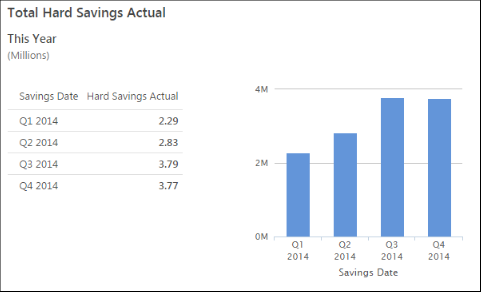
- Trend summary with one summary variable
- This summary shows hard savings this year by quarter.
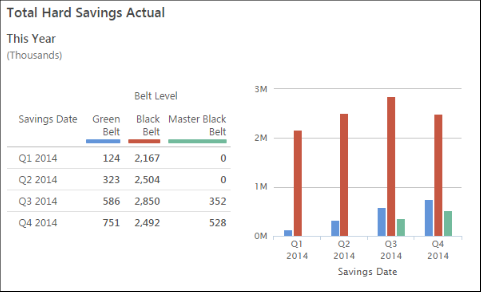
- Trend summary with one summary variable and one grouping variable
- This summary shows hard savings this year by quarter and by belt level.
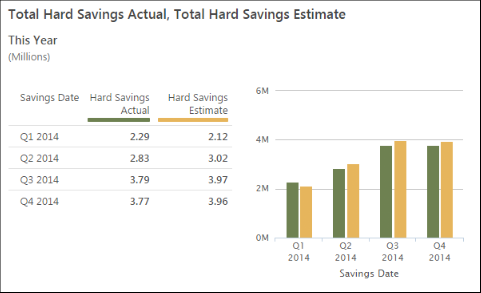
- Trend summary with two summary variables
- This summary shows actual hard savings and estimated hard savings for
this year by quarter. When you add two summary variables to a trend summary,
you cannot add a grouping variable because time is the grouping variable.
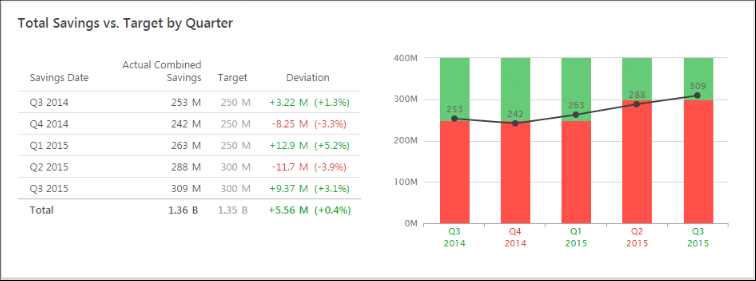
- Trend summary with one variable and different targets
- This summary compares quarterly savings to a target. In this example,
the targets are different for each quarter, but they do not have to be. You can
also set targets for future quarters.
Snapshot summaries
A snapshot summary shows data for a single time period, for example, this
year, last quarter, next month, a fixed data range that you specify. The
following images show snapshot summaries.
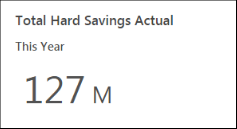
- Snapshot summary with one summary variable
- When you create a snapshot summary with one variable, a single-number
summary is displayed. This summary shows hard savings for this year.
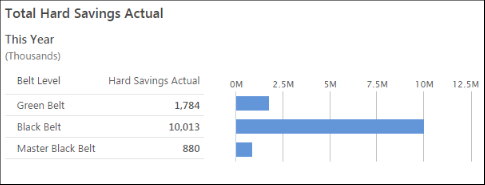
- Snapshot summary with one summary variable and one grouping variable
- This summary shows hard savings for this year by belt level.
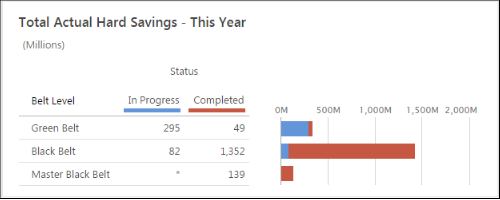
- Snapshot summary with two grouping variables
- This summary shows hard savings for this year by belt level and by
status.
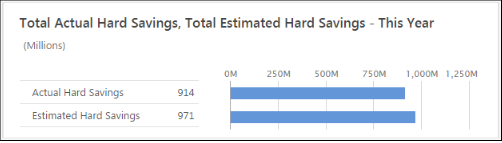
- Snapshot summary with two summary variables
- This summary shows actual hard savings and estimated hard savings for
this year.
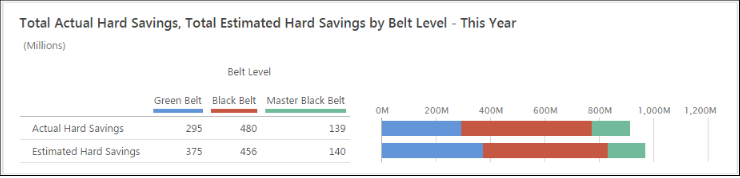
- Snapshot summary with two summary variables and one grouping variable
- This summary shows actual hard savings and estimated hard savings for
this year by belt level.
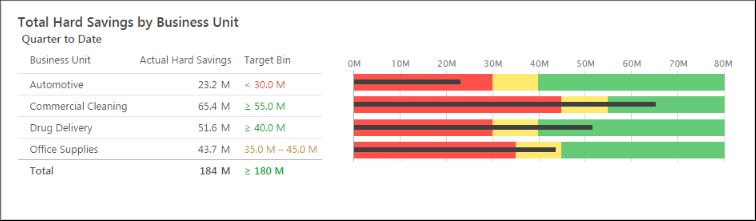
- Snapshot summary with one grouping variable and targets
- This summary shows actual hard savings in relation to low, medium, and
high ranges. This summary is for Quarter to Date, and targets can be set for
future quarters to ensure that targets appear when you enter the next
quarter.
Watch a video
Watch a video to learn more about summaries.