Objectives
Learn about maps
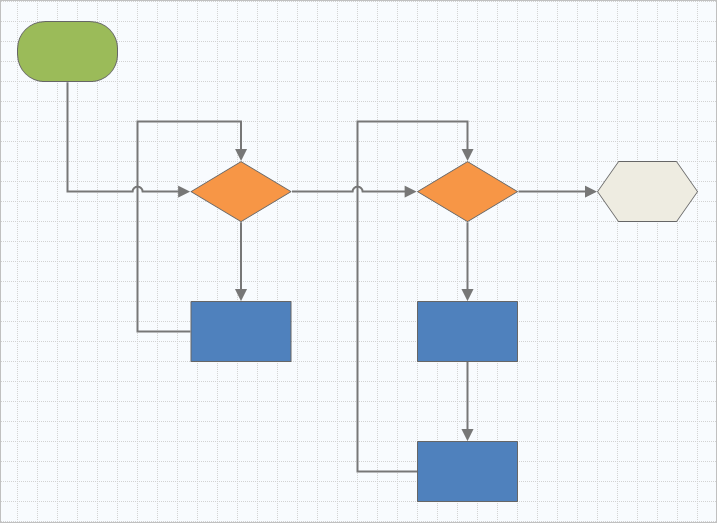
Process map
Use a process map to illustrate the sequential flow and the relationship of steps in a process or procedure.
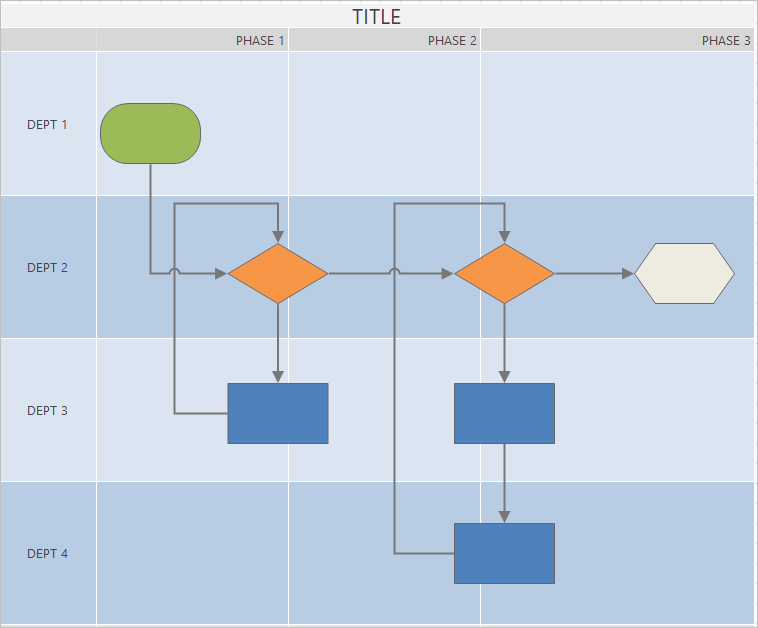
Cross-functional process map
Use a cross-functional process map to illustrate the sequential steps of a process or a procedure as they cross departments and phases. Departments (also called swim lanes) divide the steps horizontally. Phases divide the steps vertically.
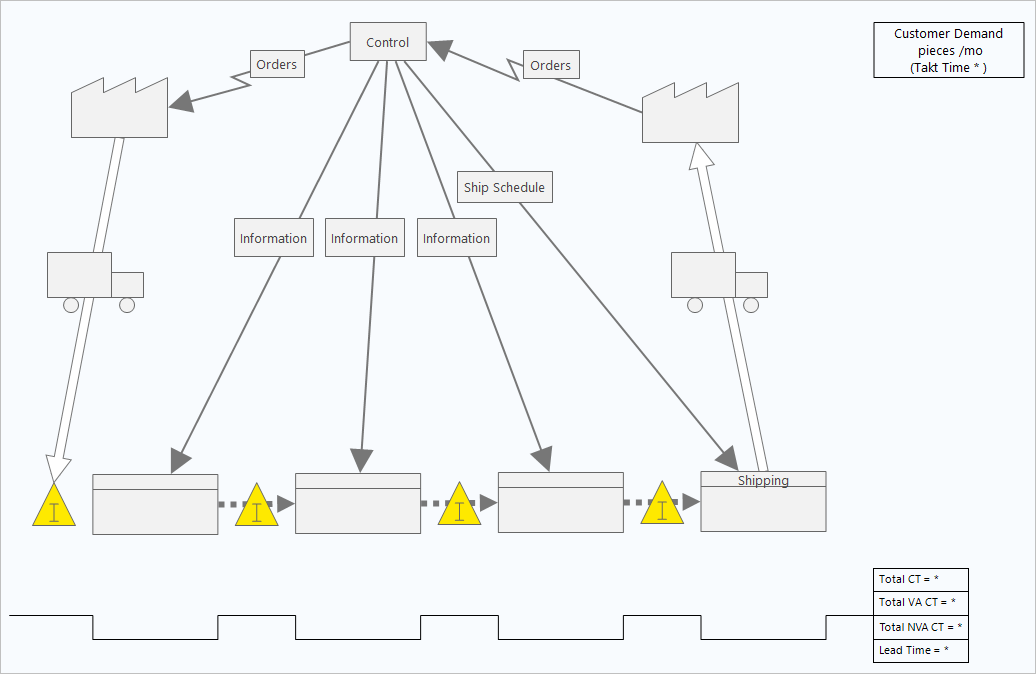
Value stream map
Use a value stream map to show how materials and information flow through the value stream. A current state value stream map helps you to identify waste and to envision an improved future state.
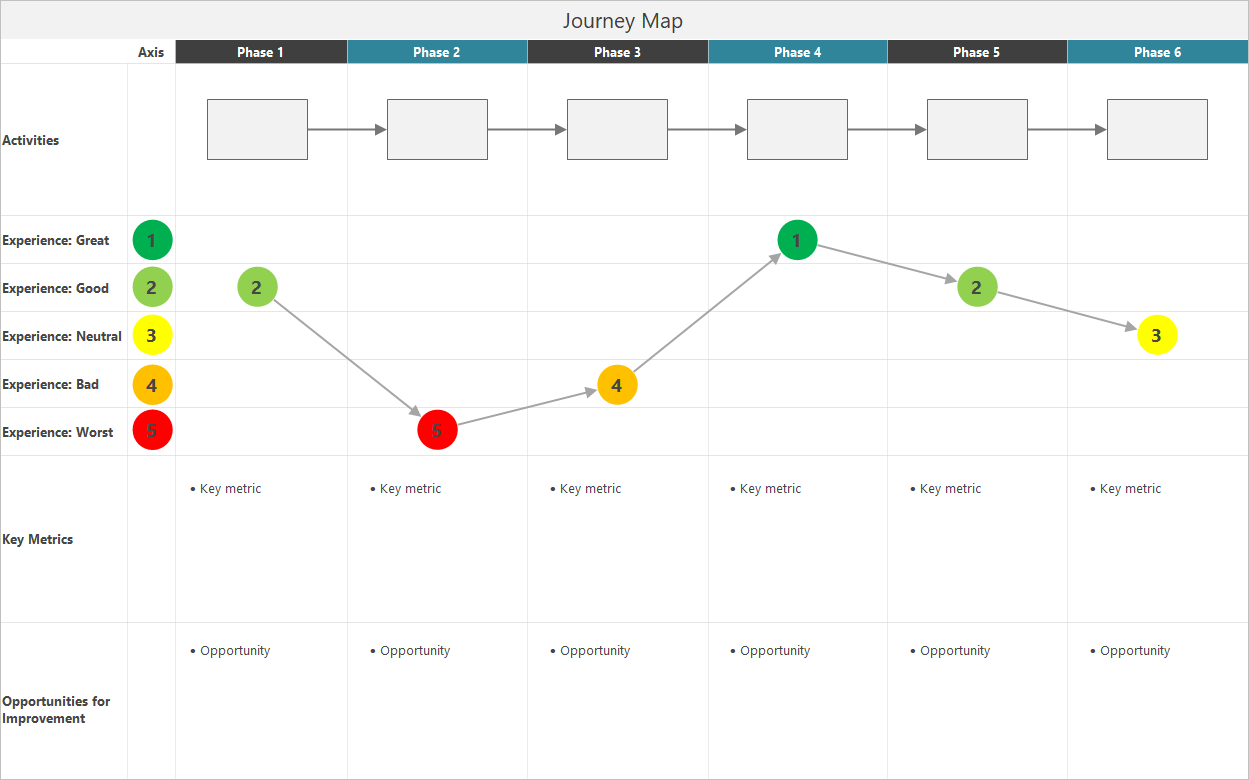
Journey map
Use a journey map to illustrate the process a person goes through as they accomplish a task.
Add a process map
Add a process map to describe the flow of your process.
- From the navigator pane, select Add Tool, then select Process Map to see the list of available process map templates. You can also browse through the list of tools or start typing the name of the tool in the Search box.
- Select Create to add the tool to your project.
Add shapes and connectors
Add shapes and connectors to visually represent the steps and flow of a process.
-
Add shapes.
-
Select the start shape
 and select the workspace. While the shape
is selected, enter text to identify the start shape.
and select the workspace. While the shape
is selected, enter text to identify the start shape.
-
Select the decision shape
 and select the workspace. While the shape
is selected, enter text to identify the decision shape.
and select the workspace. While the shape
is selected, enter text to identify the decision shape.
-
Select the start shape
-
Connect the shapes.
-
Select the right-angle connector
 , then hold the pointer on the start shape.
- When the anchor points appear on the start shape, select one and drag it to an anchor point on the decision shape. Anchor points keep the shapes connected when you move them around on the map.
-
Select the right-angle connector
-
Continue to map your process.
Tip
To add the same shape multiple times, select the Multi-Insert button, select the shape in the gallery, then select the map where you want the shape to appear. Continue to select the map until you have added as many shapes as you need. Select Multi-Insert again to turn it off. You can also use Multi-Insert with connectors.
Add variables to a shape
You can add, copy, and move X variables, Y variables, lean data, and process data to shapes on a process map to give you a better understanding of which variables affect the outcome of each step.
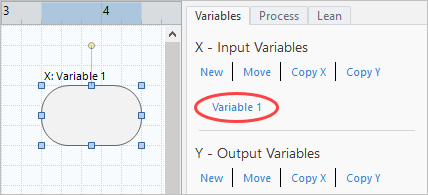
In the previous chapter, you made an X variable from a shape on a brainstorming tool. Now, you can move that X variable to a shape on your process map.
- Select a shape on the process map.
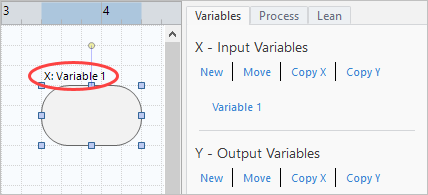
- In the task pane, open the Variables tab. Under X - Input Variables, select Move.
-
In the Data Selection dialog, select the variable, then select OK.
The variable name appears in the task pane.
Show data on a map
After you add data to a shape, you can show it on the map to see where to focus your attention.
By default, X variables display above the shape and Y variables display below the shape. To change the location or to display other shape data, complete the following steps.
- Right-click a shape, then choose .
-
In the Select and Arrange Shape Data dialog box, choose variable data
fields to position relative to the selected shape. For example, under X Variables, drag Name to the shape, position it, then select OK.
In this example, the variable name appears above the shape.