Note
This command is available with the Predictive Analytics Module. Click here for more information about how to activate the module.
A team of researchers collects data about factors that affect a quality characteristic of baked pretzels. Variables include process settings, like Mix Tool, and grain properties, like Flour Protein.
As part of the initial exploration of the data, the researchers decide to use Discover Key Predictors to compare models by sequentially removing unimportant predictors to identify key predictors. The researchers hope to identify key predictors that have large effects on the quality characteristic and to gain more insights into the relationships among the quality characteristic and the key predictors.
- Open the sample data, PretzelAcceptability.MTW.
- Choose .
- From the drop-down list, select Binary response.
- In Response, enter Acceptable Pretzel.
- In Response event, select 1 to indicate that the pretzel is acceptable.
- In Continuous predictors, enter Flour Protein-Bulk Density.
- In Categorical predictors, enter Mix Tool-Kiln Method.
- Click Discover Key Predictors
- In Maximum number of elimination steps enter 29.
- Click OK in each dialog box.
Interpret the results
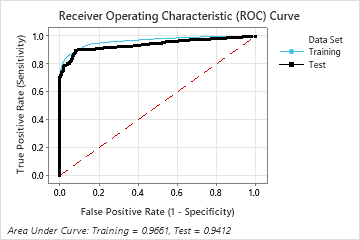
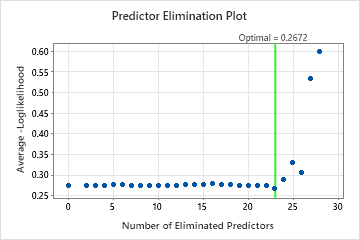
For this analysis, Minitab Statistical Software compares 28 models. The number of steps is less than the maximum number of steps because the Foam Stability predictor has an importance score of 0 in the first model, so the algorithm eliminates 2 variables in the first step. The asterisk in the Model column of the Model Evaluation table shows that the model with the smallest value of the average –loglikelihood statistic is model 23. The results that follow the model evaluation table are for model 23.
Although model 23 has the smallest value of the average –loglikelihood statistic, other models have similar values. The team can click Select an Alternative Model to produce results for other models from the Model Evaluation table.
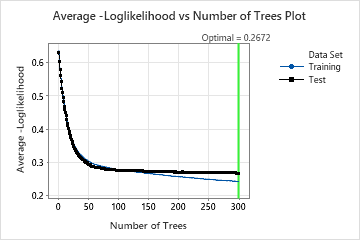
In the results for Model 23, the Average –Loglikelihood vs. Number of Trees Plot shows that the optimal number of trees is almost the number of trees in the analysis. The team can click Tune Hyperparameters to Identify a Better Model to increase the number of trees and to see whether changes to other hyperparameters improve the performance of the model.
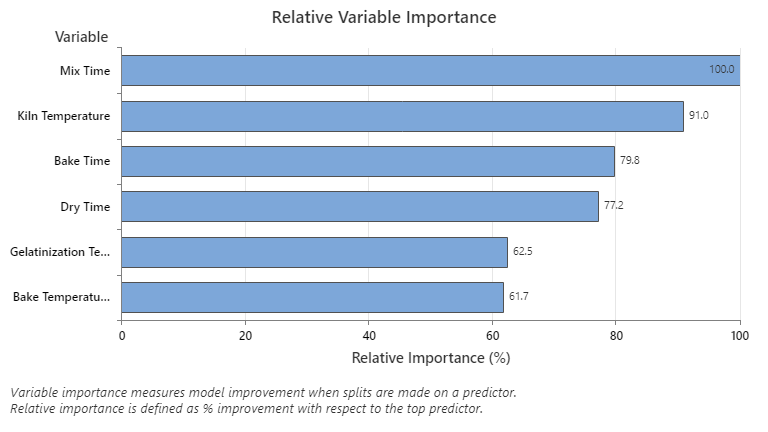
The Relative Variable Importance graph plots the predictors in order of their effect on model improvement when splits are made on a predictor over the sequence of trees. The most important predictor variable is Mix Time. If the importance of the top predictor variable, Mix Time, is 100%, then the next important variable, Kiln Temperature, has a contribution of 93.9%. This means that Kiln Temperature is 93.9% as important as Mix Time.
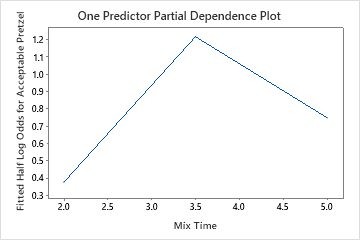
Use the partial dependency plots to gain insight into how the important variables or pairs of variables affect the fitted response values. The fitted response values are on the 1/2 log scale. The partial dependence plots show whether the relationship between the response and a variable is linear, monotonic, or more complex.
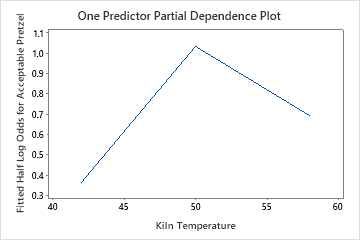
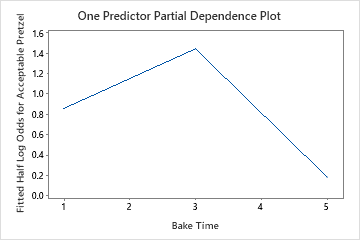
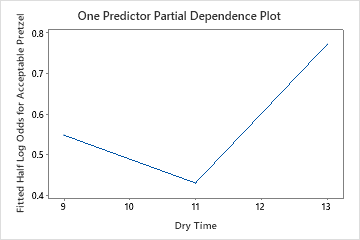
The one predictor partial dependence plots show that medium values for Mix Time, Kiln Temperature and Bake Time increase the odds of an acceptable pretzel. A medium value of Dry Time decreases the odds of an acceptable pretzel. The researchers can click Select More Predictors to Plot to produce plots for other variables.
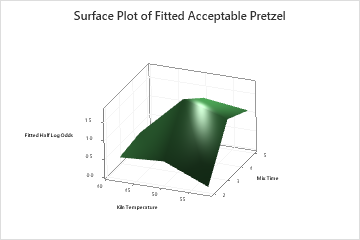
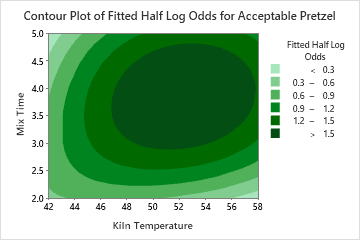
The two-predictor partial dependence plot of Mix Time and Kiln Temperature shows a more complex relationship between the two variables and the response. While medium values of Mix Time and Kiln Temperature increase the odds of an acceptable pretzel, the plot shows that the best odds occur when both variables are at medium values. The researchers can click Select More Predictors to Plot to produce plots for other pairs of variables.
TreeNet® Classification: Acceptable P vs Flour Protei, Water, Mix Time, ...
One Predictor Partial Dependence Plots
Select More Predictors to Plot...
Two Predictor Partial Dependence Plots
Select More Predictors to Plot...
TreeNet® Classification - Discover Key Predictors: Acceptable P vs Flour Protei, Water, ...
Predictor Elimination Plot
One Predictor Partial Dependence Plots
Select More Predictors to Plot...
Two Predictor Partial Dependence Plots
Select More Predictors to Plot...
TreeNet® Classification: Acceptable P vs Mix Time, Bake Time, Dry Time, ...
One Predictor Partial Dependence Plots
Select More Predictors to Plot...
Two Predictor Partial Dependence Plots
Select More Predictors to Plot...
TreeNet® Classification: Acceptable P vs Mix Time, Bake Time, Dry Time, ...
One Predictor Partial Dependence Plots
Select More Predictors to Plot...
Two Predictor Partial Dependence Plots
Select More Predictors to Plot...