About graph titles, subtitles, and footnotes
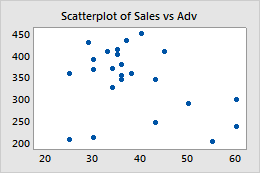
Every graph is given a title based on the type of graph and the variables you select. For example, if you draw a scatterplot of the Sales and Adv variables in your worksheet, Minitab names the graph Scatterplot of Sales vs Adv.
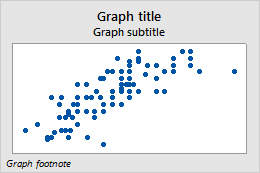
Default title
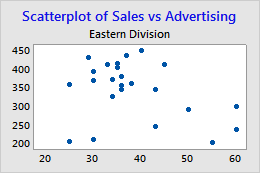
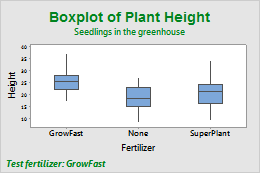
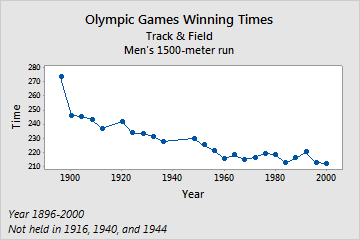
Custom title and subtitle
Note
The graph title should not be confused with the graph name. The graph name is displayed in the output pane and in the Navigator. Changing a graph title does not change the graph name and vice versa.
Add titles, subtitles, or footnotes when you create a graph
You can specify the title text or add subtitles or footnotes when you create a graph.
- In the dialog box for the graph you are creating, click Labels.
- On the Titles/Footnotes tab, enter the text for the title, subtitles, or footnotes and click OK.
Add titles, subtitles, or footnotes to an existing graph
You can add titles, subtitles, or footnotes to an existing graph.
- Double-click the graph.
- Right-click the graph and choose Add, then choose one of the following: Title, Subtitle, or Footnote.
- Enter the text to add and click OK.
Edit a title, subtitle, or footnote
To edit a title, subtitle, or a footnote, double-click it. Graphs can have multiple titles, subtitles, and footnotes.
Tip
To create a custom footnote that includes project name, worksheet name, date, time, or custom text (such as your company's name) automatically on all the graphs you create, choose .
- Double-click the graph.
-
Double-click the title, subtitle, or footnote to edit.
Tip
Click and drag to move a title, subtitle, or footnote anywhere on the graph.
-
Select the tab to make the edits that you want.
- Font: Change the text and the font, style, size, and color of the text.
- Alignment:
Specify an exact location of the title, subtitle, or footnote by entering the
following:
- Position
- Select the position of the item relative to the figure region. (Usually, the figure region covers the entire graph.) For example, to center the item, select Centered.
- Offset
- Select Custom. In Horizontal, enter the number of figure units to move the item to the left (−) or the right (+) of the selected position. In Vertical, enter the number of figure units to move the item down (−) or up (+) from the selected position.
Examples of editing titles, subtitles, or footnotes