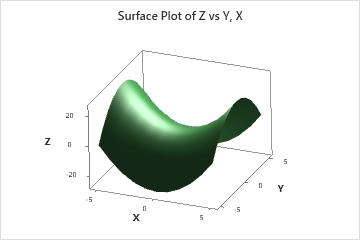
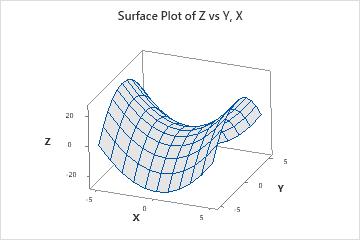
Use 3D Surface Plot to examine the relationship between a response variable (Z) and two predictor variables (X and Y), by viewing a three-dimensional surface of the predicted response. You can choose to represent the predicted response as a smooth surface or a wireframe.
For example, the following 3D surface plots show the effect of temperature and time on the quality of reheated frozen entrees.
- Surface
- Wireframe
Where to find this graph
To create a 3D surface plot, choose .