A traffic safety consultant wants to compare the number of cars per hour that travel on two different streets. Before collecting the data for a 2-sample Poisson rate test, the consultant uses a power and sample size calculation. The consultant wants to determine how large of a sample size the test needs to obtain a power of 0.9 and detect a comparison rate of 32 or 38 (a difference of 3 from the baseline rate of 35).
- Choose .
- In Comparison rates (R1), enter 32 38.
- In Power values, enter 0.9.
- In Baseline rate (R2), enter 35.
- Click OK.
Interpret the results
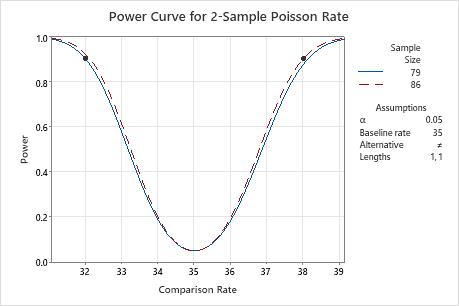
To detect a comparison rate of 32 with a power value of 0.9, the consultant needs a sample size of 79. To detect a comparison rate of 38 with a power value of 0.9, the consultant needs a sample size of 86. The analyst decides to collect a sample size of 86 to give the test a power value of at least 0.9 for both comparison rates. Because the target power value of 0.9 results in a sample size that is not an integer, Minitab also displays the power (Actual Power) for the rounded sample size.
Results
| Comparison Rate | Sample Size | Target Power | Actual Power |
|---|---|---|---|
| 32 | 79 | 0.9 | 0.902793 |
| 38 | 86 | 0.9 | 0.902550 |