Use a cause-and-effect diagram to organize brainstorming ideas about the potential causes of a problem. The diagram can help you visualize relationships between a problem (effect) and potential causes.
- Effect
- The effect is displayed on the right side of the diagram. In this example, Surface Flaws is the effect.
- Causes
- The list of causes is organized on the left side in a tree-like structure. The branches of the tree are often associated with major categories of causes. The default cause categories are Measurements, Other, Personnel, Environment, Methods, and Machines. You can customize the categories to meet the needs of your own process.
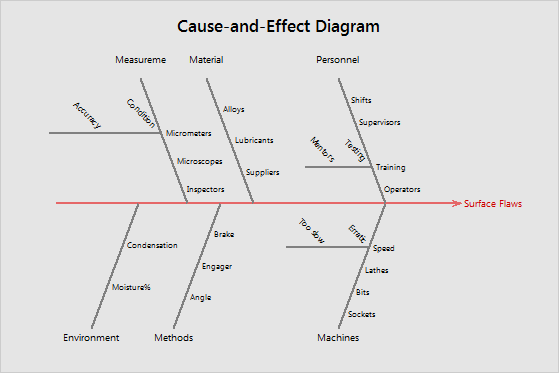
If your cause-and-effect diagram requires additional levels, you can create a second cause-and-effect diagram for each branch.