Use C Chart to monitor the number of defects where each item can have multiple defects. You should use a C chart only when your subgroups are the same size. Use this control chart to monitor process stability over time so that you can identify and correct instabilities in a process.
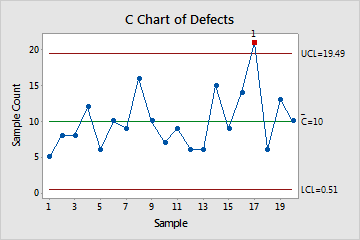
For example, an LCD manufacturer wants to monitor defects on 17-inch LCD screens. Technicians record the number of dead pixels for each subgroup of 10 screens per hour and use a C chart to monitor the number of dead pixels.
The chart shows that, on average, technicians find 10 dead pixels in each sample. Sample 17 is out of control. The technicians should identify any special causes that contribute to the unusually high number of dead pixels.
Where to find this control chart
To create a C chart, choose .
When to use an alternate control chart
-
If your subgroup sizes are not equal, use U Chart, or Laney U' Chart.
- If you can determine only whether each item is defective or nondefective, use P Chart or Laney P' Chart to plot the proportion of defective items, or use NP Chart to plot the number of defective items.
- If your data exhibit overdispersion or underdispersion, Laney U' Chart may more accurately distinguish between common-cause variation and special-cause variation. Overdispersion can cause a C chart to show an increased number of points outside the control limits. Underdispersion can cause a C chart to show too few points outside of the control limits. The Laney U' chart adjusts for these conditions. You can test your data for overdispersion and underdispersion with U Chart Diagnostic. For more information, go to Overdispersion and underdispersion.