In This Topic
Chi-square test statistics
Minitab displays two chi-square statistics.
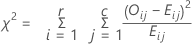
Pearson chi-square statistic:
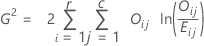
Likelihood-ratio chi-square statistic:
Note
If any cell has an expected frequency less than one, the p-value for the test is not displayed because the results may not be valid. If some cells have small expected frequencies, consider combining or omitting row and/or column categories.
Yates' correction for 2 x 2 tables is not used.
Notation
| Term | Description |
|---|---|
| Oij | observed frequency in cell (i, j) |
| Eij | expected frequency for cell (i, j)
 |
| r | number of rows |
| c | number of columns |
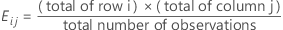
Expected cell count
The expected count is the frequency that would be expected in a cell, on average, if the variables are independent. Minitab calculates the expected counts as the product of the row and column totals, divided by the total number of observations.
Formula

Notation
| Term | Description |
|---|---|
| ni+ | number of observations in the ith row |
| n+j | number of observations in the jth column |
| n++ | total number of observations |
Raw residual calculation
Formula
Raw residual = Oij – Eij
Notation
| Term | Description |
|---|---|
| Oij | observed frequency in cell (i, j) |
| Eij | expected frequency for cell (i, j) |
Standardized residual calculation
Formula

Notation
| Term | Description |
|---|---|
| Oij | observed frequency in cell (i, j) |
| Eij | expected frequency for cell (i, j) |
Adjusted residual calculation
Formula

Notation
| Term | Description |
|---|---|
| Oij | observed frequency in cell (i, j) |
| Eij | expected frequency for cell (i, j) |
| ni+ | number of observations in the ith row |
| n+j | number of observations in the jth column |
| n++ | total number of observations |
Contribution to chi-square statistic from each cell
Formula
The contribution to the χ2 statistic from each cell is:

Notation
| Term | Description |
|---|---|
| Oij | observed frequency in cell (i, j) |
| Eij | expected frequency in cell (i, j) |