Bias examines the difference between the observed average measurement and a reference value. Bias indicates how accurate the gage is when compared to a reference value.
Linearity
Linearity examines how accurate your measurements are through the expected range of the measurements. Linearity indicates whether the gage has the same accuracy across all reference values.
Example of measuring gage accuracy with bias and linearity
A manufacturer wants to know whether a thermometer provides accurate and consistent measurements at five heat settings: 202°, 204°, 206°, 208°, and 210°. Six measurements are taken at each setting. To determine whether the thermometer is biased, subtract the individual measurements from the reference value. The bias values for measurements taken at heat setting 202° are calculated in this table.
Measurement
Actual
Bias
202.7
-
202
=
0.7
202.5
-
202
=
0.5
203.2
-
202
=
1.2
203.0
-
202
=
1.0
203.1
-
202
=
1.1
203.3
-
202
=
1.3
The temperature measurements at the 202° heat setting are positively biased. The thermometer gives measurements that are higher than the actual temperature.
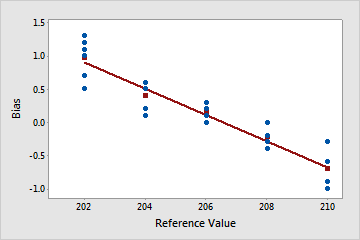
To interpret the linearity of the thermometer data, determine whether the bias of the thermometer changes across the heat settings. If the data do not form a horizontal line on a scatterplot, linearity is present.
The scatterplot shows that bias changes as the heat settings increase. Temperatures for lower heat settings are higher than the actual temperatures, while measurements for higher heat settings are lower than the actual temperatures. Because bias changes over the heat settings, linearity is present in this data.