You can apply filters to segment reports by region, location, belt level, and so on. Filters can help you analyze your data more closely so you can gain further insight into your company's improvement initiative.
When you apply or remove filters, Engage maintains your filter settings, even if you switch reports. However, default filter settings are restored every time you sign in. To change the default filter settings, apply the filters in edit mode. For more information, go to Create filters.
- Under the report name, select the add button
 , then choose the filter to apply to the report. You can apply more than one filter to a report.
 - When a filter has multiple options, select the drop-down list button
 , choose the filter options to include in the report, then select Update. For information about how filters determine report results, see the following example. In the following image, the gray dot next to My Projects indicates that it is the default selection.
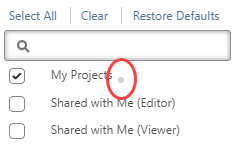
Example of how multiple filters and filter options determine report results
When you apply multiple filters, Engage performs an AND operation between the filters and performs an OR operation between selected filter options. For example, three filters are defined with the following criteria.
- DMAIC
- Project Type IS DMAIC; AND
- In Progress
- Project Status IS In Progress; AND
- Projects by Region
- Region IS North America OR European Union
When the filters are applied, the report shows only DMAIC projects that
are in progress in either North America or the European Union.
Note
When you apply multiple filters using data fields from a data table category, such as Tasks, Engage evaluates each row of the data table to calculate results.
Watch a video
Watch a video to learn more about filters.