


Blog Article
Accelerate Idea Generation, Innovation and Business Transformation with Minitab Engage ›
Got questions? Find the help you need, whenever you need it.

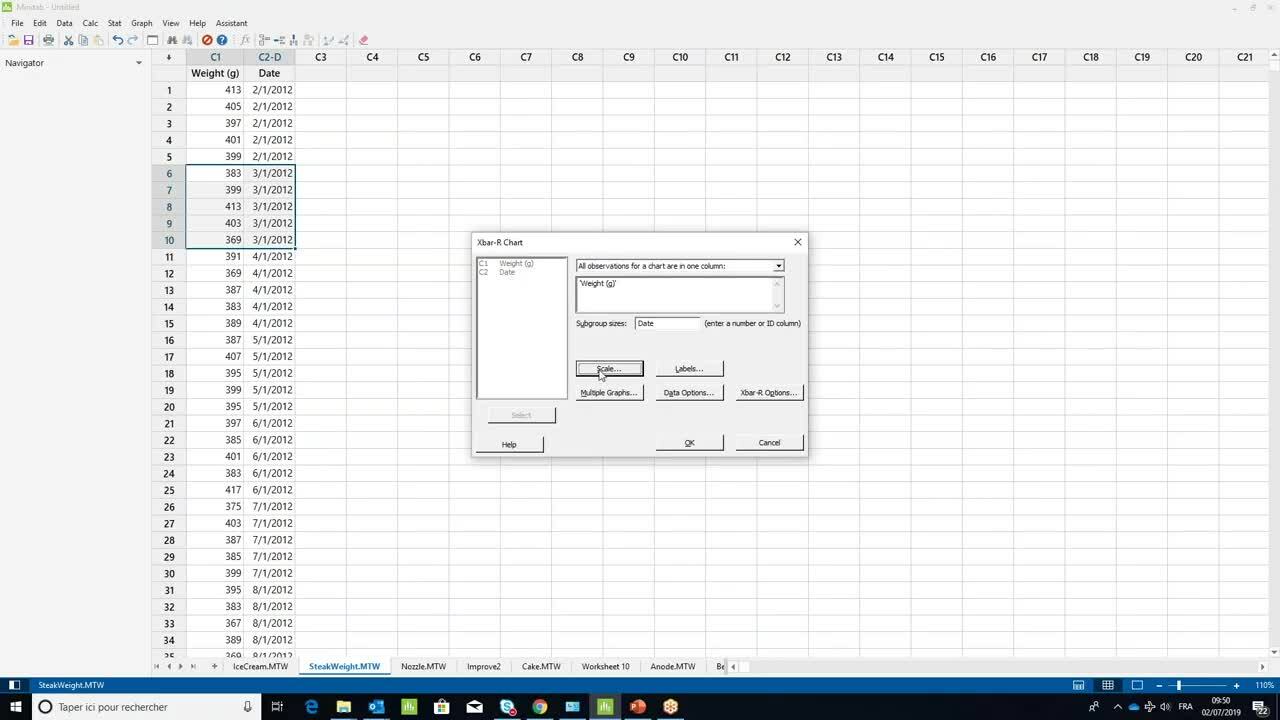
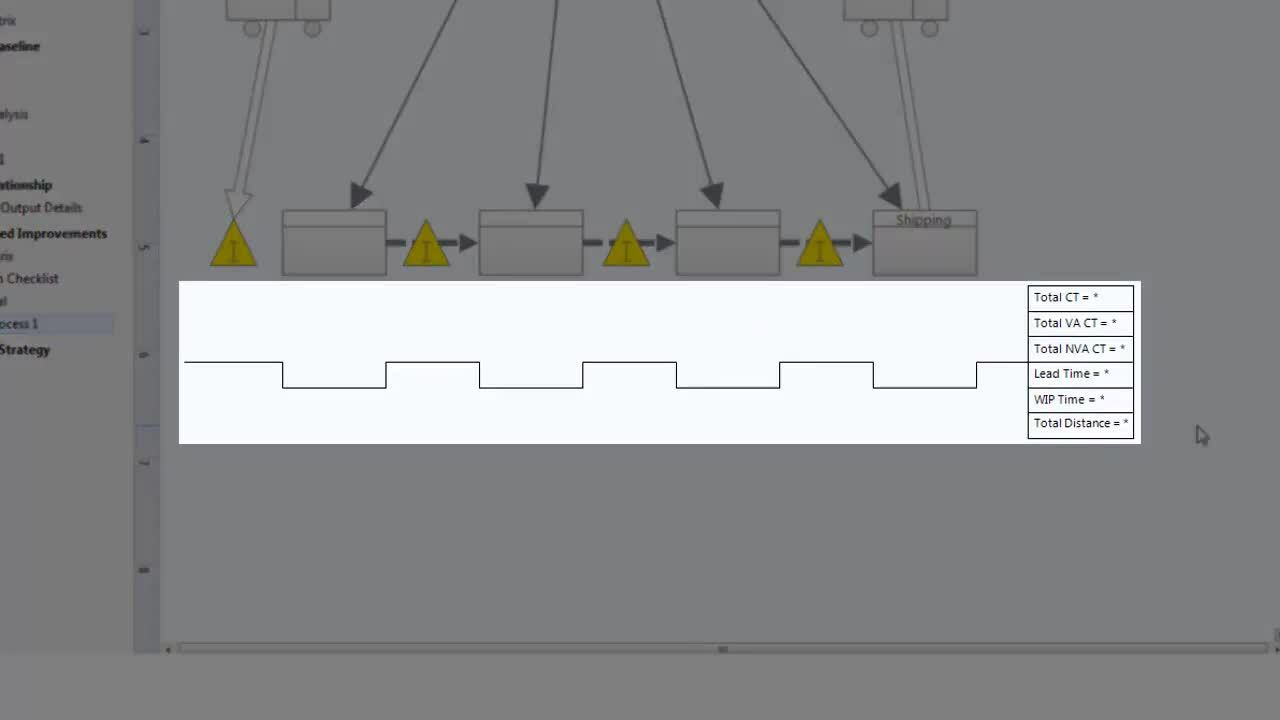
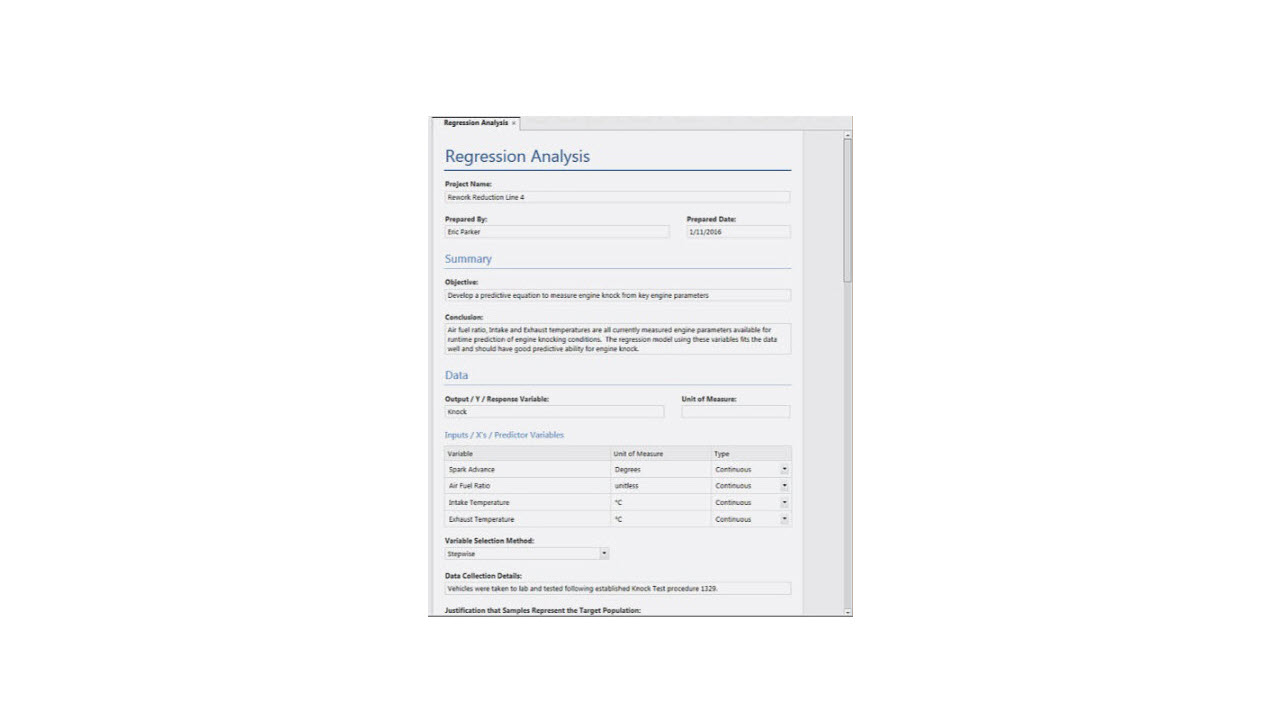
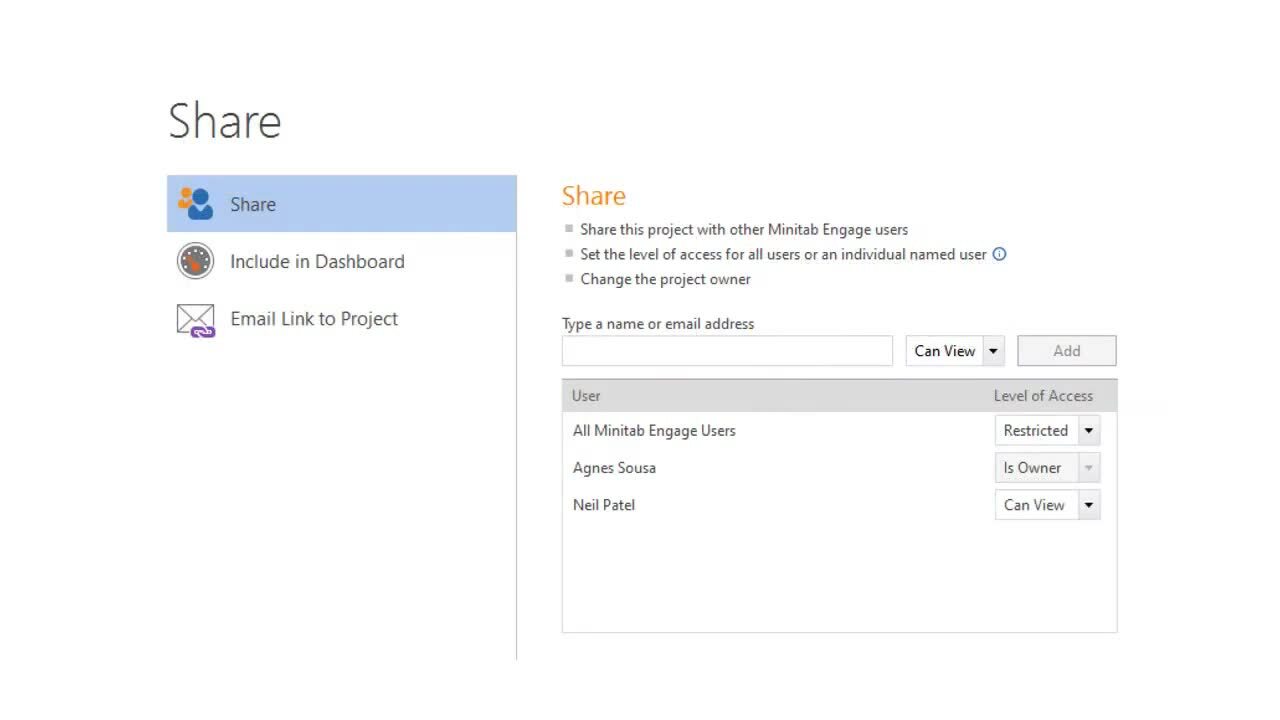
Featured Support Videos
Watch helpful videos to learn how to get started using our software, uncover product features, and more.
1:26
3:54
1:26
3:47
Additional Resources
Discover use cases, tips, techniques, and product features to accelerate your analytics journey.
Additional Minitab Support
Training
Explore training options, upcoming courses, learning paths, and more.
Resources
Access additional resources to learn how Minitab can work for you.
You are now leaving minitab.com.
Click Continue to proceed to:


