- Index
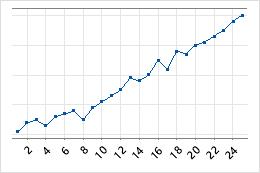
- Select to label the x-axis with integers.
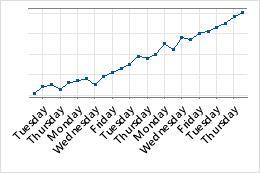
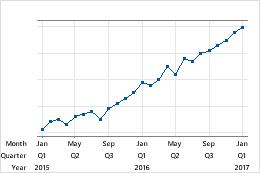
- Calendar
- Select to label the x-axis with the day, month, quarter, year, or a combination of the options. For example, if you choose Month Quarter Year, Minitab assumes that your data are in intervals of 1 month and generates 3 scales on the x-axis: 1 for months, 1 for quarters, and 1 for years. At each 3rd tick mark on the month scale, Minitab generates a tick mark on the quarter scale. At each 4th tick mark on the quarter scale, Minitab generates a tick mark on the year scale.
-
Start value: Specify the starting value for the day, month, quarter, or year. Day values can range from 1-31, month values can range from 1-12, quarter values can range from 1-4, and year values must be 1000 or higher.
You must enter a value for each time unit you selected for Calendar. For example, if you choose Day Month Year and you want the scale to start on January 1st, 2015, enter 1 1 2015.
Note
If you leave this field blank, Minitab uses the current day, month, quarter, and year.
- Increment: Specify the time increment between observations. The value you enter specifies the time increment for the shortest time unit you selected for Calendar. For example, if you choose Month Quarter Year and enter 2 for Increment, Minitab assumes your data are in intervals of 2 months. However, if you choose Quarter Year and enter 2 for Increment, Minitab assumes your data are in intervals of 6 months (2 quarters).
Note
If you leave this field blank Minitab uses a value of 1.
-
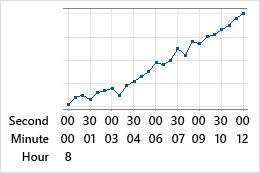
- Clock
- Select to label the x-axis with the day, hour, minute, second, or a combination of the four options. For example, if you choose Day Hour Minute, Minitab assumes that your data are in intervals of 1 minute and generates 3 scales on the x-axis: 1 for days, 1 for hours, and 1 for minutes. At each 60th tick mark on the minute scale, Minitab generates a tick mark on the hour scale. At each 24th tick mark on the hour scale, Minitab generates a tick mark on the day scale.
-
Start value: Specify the start value for the day, hour, minute, or second. Day values can range from 1-31, hour values can range from 0-23, and minute and second values can range from 0-59.
You must enter a value for each time unit you selected for Calendar. For example, if you choose Hour Minute Second, and you want the scale to start at 8:00 AM, enter 8 0 0.
Note
If you leave this field blank, Minitab uses the current day and starts the other time units at 0.
- Increment: Specify the time increment between observations. The value you enter specifies the time increment for the shortest time unit you selected for Clock. For example, if you choose Hour Minute Second and enter 30 for Increment, Minitab assumes your data are in intervals of 30 seconds. However, if you choose Hour Minute and enter 30 for Increment, Minitab assumes your data are in intervals of 30 minutes.
Note
If you leave this field blank Minitab uses a value of 1.
-
- Stamp
-
Select to label the x-axis with values, such as dates, from a column. You can enter up to 3 columns that contain date/time, numeric, or text scale values.