Linear
Formula
The linear trend model is:
Yt = β0 + β1 t + et
Notation
| Term | Description |
|---|---|
| β0 | the constant |
| β1 | average change from one period to the next |
| t | value of the time unit |
| et | the error term |
Exponential growth
Formula
The exponential growth trend model accounts for exponential growth or decay. For example, a savings account might exhibit exponential growth.
Yt = β0 * β1t * et
Notation
| Term | Description |
|---|---|
| β0 | the constant |
| β1 | the coefficient |
| t | value of the time unit |
| et | the error term |
Quadratic
Formula
The quadratic trend model, which can account for simple curvature in the data, is:
Yt = β0 + β1 t + β2 t2 + et
Notation
| Term | Description |
|---|---|
| β0 | the constant |
| β1 and β2 | the coefficients |
| t | value of the time unit |
| et | the error term |
S-curve
Formula
The data has an S-shape, which indicates that the direction of the change varies over time.
Yt = 10a / (β0 + β1 β2t )
Notation
| Term | Description |
|---|---|
| β0 | the constant |
| β1 and β2 | the coefficients |
| t | value of the time unit |
Weights
If you supply coefficients from a previous trend analysis fit, Minitab performs a weighted trend analysis. If the weight for a particular coefficient is α, Minitab estimates the new coefficient by:
Formula
α p1 + (1 – α)p2
Notation
| Term | Description |
|---|---|
| p1 | coefficient estimated from the current data |
| p2 | prior coefficient |
Forecasts
Minitab uses the trend equation to calculate the forecast for specific time values. Data before the forecast origin are used to fit the trend.
MAPE
Mean absolute percentage error (MAPE) measures the accuracy of fitted time series values. MAPE expresses accuracy as a percentage.
Formula
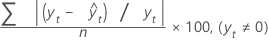
Notation
| Term | Description |
|---|---|
| yt | actual value at time t |
 | fitted value |
| n | number of observations |
MAD
Mean absolute deviation (MAD) measures the accuracy of fitted time series values. MAD expresses accuracy in the same units as the data, which helps conceptualize the amount of error.
Formula
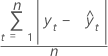
Notation
| Term | Description |
|---|---|
| yt | actual value at time t |
 | fitted value |
| n | number of observations |
MSD
Mean squared deviation (MSD) is always computed using the same denominator, n, regardless of the model. MSD is a more sensitive measure of an unusually large forecast error than MAD.
Formula
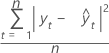
Notation
| Term | Description |
|---|---|
| yt | actual value at time t |
 | fitted value |
| n | number of observations |