In This Topic
Step 1: Determine whether the model fits your data
- If the model fits the data, you can perform Single Exponential Smoothing and compare the two models.
- If the model does not fit the data, examine the plot for trends or seasonality. If you see evidence of a trend or seasonality, you should use a different time series analysis. For more information, go to Which time series analysis should I use?.
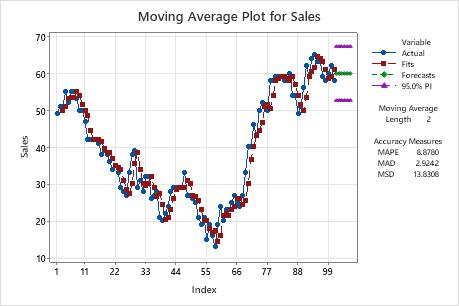
On this smoothing plot, the fits closely follow the data, which indicates that the model fits the data.
Step 2: Compare the fit of your model to other models
Note
The accuracy measures provide an indication of the accuracy you might expect when you forecast out 1 period from the end of the data. Therefore, they do not indicate the accuracy of forecasting out more than 1 period. If you're using the model for forecasting, you shouldn't base your decision solely on accuracy measures. You should also examine the fit of the model to ensure that the forecasts and the model follow the data closely, especially at the end of the series.
Model 1
Accuracy Measures
| MAPE | 7.265 |
|---|---|
| MAD | 16.621 |
| MSD | 518.119 |
Model 2
Accuracy Measures
| MAPE | 2.474 |
|---|---|
| MAD | 9.462 |
| MSD | 135.701 |
Key Results: MAPE, MAD, MSD
In these results, all three numbers are lower for the 2nd model compared to the 1st model. Therefore, the 2nd model provides the better fit.
Step 3: Determine whether the forecasts are accurate
Examine the fits and the forecasts in the plot to determine whether the forecasts are likely to be accurate. The forecasts should generally follow the data at the end of the series. If the fits shift away from the data at the end of the series, the forecasts may not be accurate. Because the forecasts from moving average are constant, it is important that there is no trend in the data before the forecasts. If there is a trend before the forecasts, the forecasts may not be accurate.
The forecasts from moving average are very conservative because they are based solely on the latest estimate of the level, and no estimate of the trend. You should usually only forecast 6 periods into the future.
On this smoothing plot, the fits closely follow the data, especially at the end of the series. You can expect sales to be around 58 for the next 6 months with a range of approximately 52 and 65.