A toothpaste retailer collects sales data and the number of commercials that were broadcast during the previous 60 weeks. The retailer creates a time-series model for prediction of sales.
- Open the sample data, ToothpasteSales.MTW.
- Choose .
- In Variable, enter Sales.
- In MA length, enter 2.
- Select Generate forecasts. In Number of forecasts, enter 6.
- Click OK.
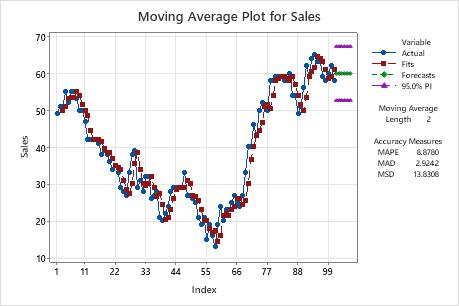
Interpret the results
On the moving average plot, the forecasts and line closely follow the data, especially at the end of the series. The retailer can be 95% confident that the sales will be between approximately 53 and 67 for the next 6 months.
Method
| Data | Sales |
|---|---|
| Length | 101 |
| NMissing | 0 |
Moving Average
| Length | 2 |
|---|
Accuracy Measures
| MAPE | 8.8780 |
|---|---|
| MAD | 2.9242 |
| MSD | 13.8308 |
Forecasts
| Period | Forecast | Lower | Upper |
|---|---|---|---|
| 102 | 60 | 52.7109 | 67.2891 |
| 103 | 60 | 52.7109 | 67.2891 |
| 104 | 60 | 52.7109 | 67.2891 |
| 105 | 60 | 52.7109 | 67.2891 |
| 106 | 60 | 52.7109 | 67.2891 |
| 107 | 60 | 52.7109 | 67.2891 |