Use Time Series Plot to look for patterns in your data over time, such as trends or seasonal patterns. A time series plot can help you choose a time series analysis to model your data. For more information, go to Which time series analysis should I use?.
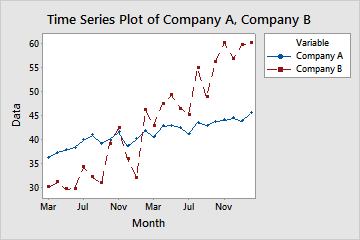
The following time series plot shows the stock prices for two companies over time. The stock price for Company B appears to be growing in value faster than the stock price for Company A.
Where to find this graph
To create a time series plot, choose one of the following
When to use an alternate graph
Time Series Plot and other time series analyses assume that data are collected at regular intervals, such as once a day, or once a month. If you collect data at irregular intervals, consider using a scatterplot instead to plot the measurement data on the y-axis and the time intervals on the x-axis.